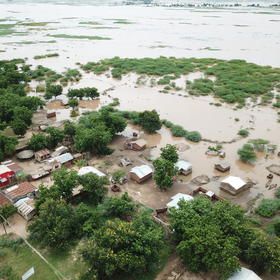
UNICEF Arm 2030 Vision #1: Flood Prediction in Malawi
'/%3e%3c/g%3e%3cuse xlink:href='%23b' transform='rotate(10)'/%3e%3c/g%3e%3cuse xlink:href='%23c' transform='rotate(20)'/%3e%3c/g%3e%3cuse xlink:href='%23d' transform='rotate(40)'/%3e%3c/g%3e%3cuse xlink:href='%23e' transform='rotate(-80)'/%3e%3c/g%3e%3cpath d='M-225-21.5h450v7.5h-450z'/%3e%3cpath fill='%23339E35' d='M-225 86h450v100h-450z'/%3e%3c/svg%3e)
Helping Malawi
$10 000 USD
Completed (~6 years ago)
Forecast
1996 joined
484 active
Start
Dec 02, 19
Close
May 17, 20
Reveal
May 17, 20

How can we include slope features ?
Help · 16 Mar 2020, 20:24 · edited ~1 hour later · 16
Dear All,
The drainage of the water seems to be an importante factor of flood in the lowest area. In my prediction I tried to add columns with range of Altitudes. I subset the altitude [40m to 2xxx m] to 5 or 6 levels and included for learning machine. This feature has improved to score but not enougth. Could any one share how can we take the slope in account? Thanks
d2 = data.frame(lon=df$X,lat = df$Y,elevation = df$elevation)
rast = raster::rasterFromXYZ(d2)
raster::crs(rast) = c("+proj=longlat +datum=WGS84 +no_defs +ellps=WGS84 +towgs84=0,0,0")
####
slope= raster::terrain(rast,opt = 'slope', unit = 'degrees',neighbors = 8)
slope_values = raster::extract(slope,insert your data coordinates in spatialpoints format)
Hope this helps
Dear Holar,
Many Thanks! It is realy helpful.
Best Regards,
Hi Holar,
How did you extract the latitude and longitude of each rectangle
Columns X(Longitude) and Y(Latitude) are the Coordinates for each rectangle.
You're Welcome
Thanks Holar
Thanks, Holar you are showing a good example on the platform, which will help the beginners and community a lot.
Surely we have more discussion in the end month. Enjoy your Top Position
is there any way to do it in python ?
Check rasterio library
Hi Holar, the end result of running the code has NaN values for some points. Is this an expected behavior?
Hello, Can you explain to us how did you subset the altitude to 5 or 6 levels ? . Thank you so much
you need to plot the region using different color depending on Altitude intervals (ranges). Changes the interval following a logic of water movement. Then try to cluster/group surfaces with high risk of Flood with the same color. Finally, you can obtain different color for Lac, Rivers, Mountain, plain, .... It is not perfect but maybe useful. ..
Thank you so much
Help guys!....has anyone managed to calculate slope in Python!?
Compute as arctan. As Holar mentioned before (check code) we have 8 neighbours for 1 square (but squares on edges are exceptions).
Due to wikipedia (https://en.wikipedia.org/wiki/Grade_(slope)) and/or common sense: 1) evaluare elevation difference between neighbours (8 values). 2) evaluate distance between neighbours (8 values too).
I used geopy for task #2. Task #1 evaluated in clear python (I mean numpy and pandas ofc).
Example:
train['slope_A'] = (np.arctan(train['elevgrad_A']/(train.apply(lambda row: geodesic(point_1, point_2).m, axis=1))))*180/np.pi
Here:
train['slope_A'] - 1 of 8 slopes (pandas)
np.arctan - slope evaluation in rads (np = numpy)
train['elevgrad_A'] - 1 of 8 difference between neighbours
train.apply(lambda row: geodesic(point_1, point_2).m, axis=1 - evaluation for distance between neighbours (geopy)
*180/np.pi - translation to degrees (not sure that this is necessary)
Thanks very much! @Randolf......I will give it a try!