Farm Pin Crop Detection Challenge
'%3e%3cpath fill='%23001489' d='M0 0v6h9V0z'/%3e%3cpath fill='%23e03c31' d='M0 0v3h9V0z'/%3e%3cg stroke='%23fff' stroke-width='2'%3e%3cpath id='d' d='m0 0 4.5 3L0 6m4.5-3H9'/%3e%3cuse xlink:href='%23b' stroke='%23ffb81c' clip-path='url(%23c)'/%3e%3c/g%3e%3cuse xlink:href='%23d' fill='none' stroke='%23007749' stroke-width='1.2'/%3e%3c/g%3e%3c/svg%3e)

First, I will like to congratulate all “Zindians” who made a place on the leaderboard. This competition presented a difficult and unique problem. It took me months to understand the problem and make my first submission.
Convolutional Neural Networks is the gold standard for image classification. However, I dared to challenge the norm by leveraging a traditional tree based ML solution largely because I wanted a low-cost solution that is fit for use in Africa. Deep learning models require huge computing power. I am a huge fan of R programming language, as such I used R to solve this problem.
All images across the 11-time slices were extracted utilising the Raster package in R. Leveraging the spectral bands, I was able to create different vegetation indices such as NDVI, NDRE, WDRVI, MTCI etc. I used 10 of the most significant ones. Vegetation indices were quite helpful because they tell you information about the vegetation on ground such as greenness, water content, height etc. I alternated between using the median value and mean values of the image pixels based on whichever gave me a better cross validation (CV) score.
Next, because tree crops like Pecan and Dates remain relatively same year-round while crops like maize are harvested every few months, I created features around the standard deviation of the calculated Vegetation indices. For example, the greenness of Tree crops will remain relatively stable while that of crops like Maize will decline during planting periods.
Furthermore, the behaviour of varying greenness was utilised to create features around period from planting to harvesting. For instance, I extracted the date were NDVI was lowest from when it was highest to obtain duration. Also, interactions amongst the important features were created.
Once all the feature extraction and Engineering was completed, I was faced with another problem - high dimensionality of data. I had in the excess of 15,000 features. Failure to address this will lead to overfitting resulting in poor model performance. Using a feature selection algorithm, I reduced the feature to a total of 500 features.
Finally, 3 different models using 3 different samples were utilised to create an ensemble of models with XGBoost algorithm as the base.
Congratulations on winning the competition!
Nice job constructing all these features!
Thanks PermanentPon. Congratulations as well.
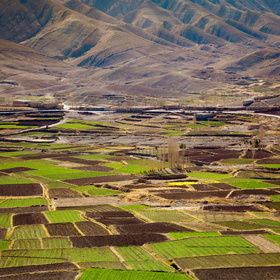
Awesome job, DrFad! I also used NDVI in my submissions (with the mean values) with decision trees but since I'm new to measuring plants with satellite images I didn't know about the existence of NDRE, WDRVI, MTCI, etc. So much to learn! But my gut feeling was that a tree-based model would do well in this competition since the fields are too small for a CNN to be applied easily.
Great job on feature engineering too. The prize is well deserved!
What algorithm or package did you use to pick 500 features out of 15,000?
Thanks. The Boruta package in R works. It utilises a variant of random forest.
Good job!
Thank you Blenz.
What was your hardware specs please.....congrats
@ Chuka19952. Thank you. Because it wasnt a deep learning model. 16GB RAM, 3.5GHz clockspeed and core i7 processor did the job.
Congratulations DRfad. Wonderful
Thank you Nasere
@DrFad Congratulations!
If possible could you kindly share the code you used for feature engineering and feature selection
Thanks. Please see below code for feature selection.
library(Boruta)
# library(doParallel) #Optional for parallel running
# registerDoParallel(cores = 4) #Optional for parallel running
set.seed(123456)
Farm_Boruta_Out <- Boruta(Crop_Id_Ne ~ . , data=Farm_train_med_all[,-c(1)], doTrace=2)
Farm_boruta_signif <- names(Farm_Boruta_Out$finalDecision[Farm_Boruta_Out$finalDecision %in% c("Confirmed","Tentative")]) # collect Confirmed and Tentative variables
print(Traffic_boruta_signif) # significant variables
Farm_Imp <- as.data.frame(Farm_Boruta_Out$ImpHistory)
Farm_Imp[is.na(Farm_Imp)] <- 0
Farm_Imp <- sapply(Farm_Imp,FUN=mean) #Obtain dataframe for list of features and their importance
plot(Farm_Boruta_Out, cex.axis=0.6, las=2, xlab="", main="Variable Importance") # plot variable importance
grid(ny = 100, lty = "dotted",lwd = 2)
save(Farm_Boruta_Out,Farm_boruta_signif, file = "Farm_Featue_Selection5.rda") #Save feature selection as rda for later use
Thank you!
You are welcome