
Laduma Analytics Football League Winners Prediction Challenge

My solution consists of these four steps
1. Predict the sequences in which goals are occuring.
2. Predict the team that has scored the goal.
3. Predict the probability for home-win, draw and away-win.
4. Blend
1. Predict the sequences in which goals are occuring.
Essentially the core observation is, that time-intervalls in which goals occur are much longer.
game = game.sort_values(by=["Start_minutes", "End_minutes"])
game["End_minutes_max_diff_current"] = game["End_minutes"].cummax() - game["End_minutes"]
In Most cases this yields a feature that can be used to predict accurately if a goal has been scored.
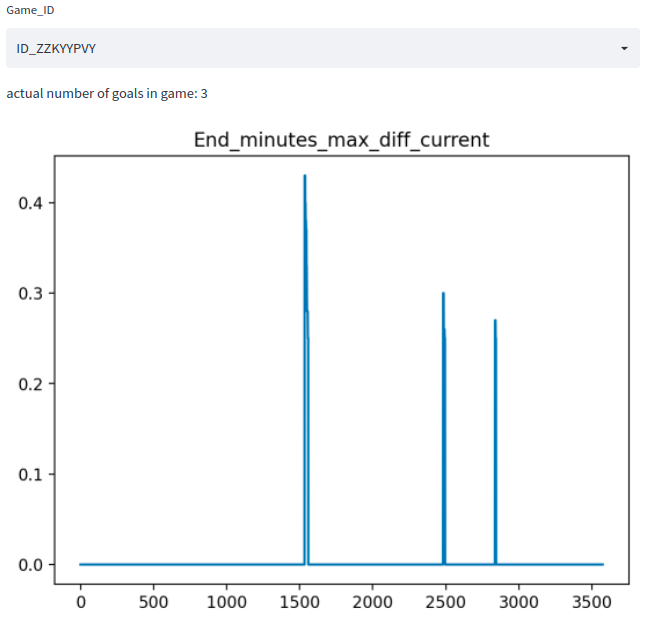
Using a simple thresholding-technique we can get an accuracy of ~ 99% on the train-set, where accuracy here means the number of games in which we accurately predict the number of goals.
2. Predict the team that has scored the goal.
One key-feature here is the proximity to the goal. The closer we are to a goal the more likely it seems that the score has been made on that specific goal. The below plot shows an intervall in which a goal was scored. The X-axis is the observation, Y-axis is the X-Position of the observation. The generall Trend here is that the larger the X-Value the more likely it is that this team has scored.
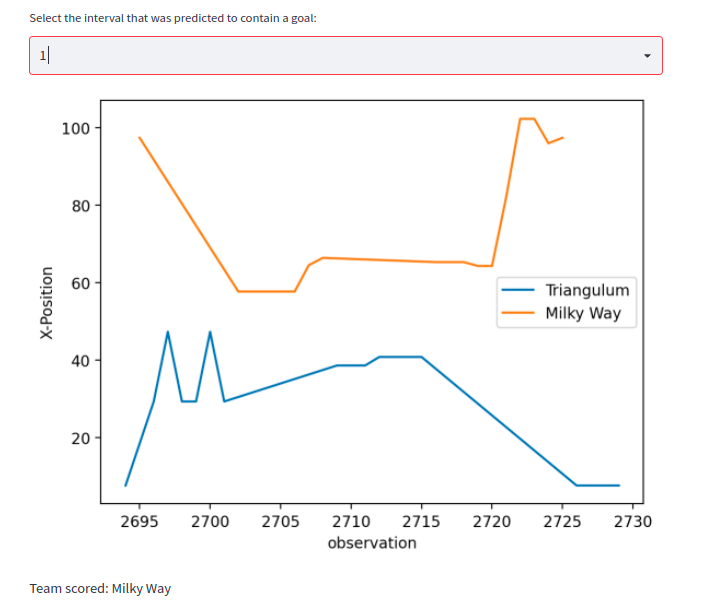
Allthough there are also more difficult examples:
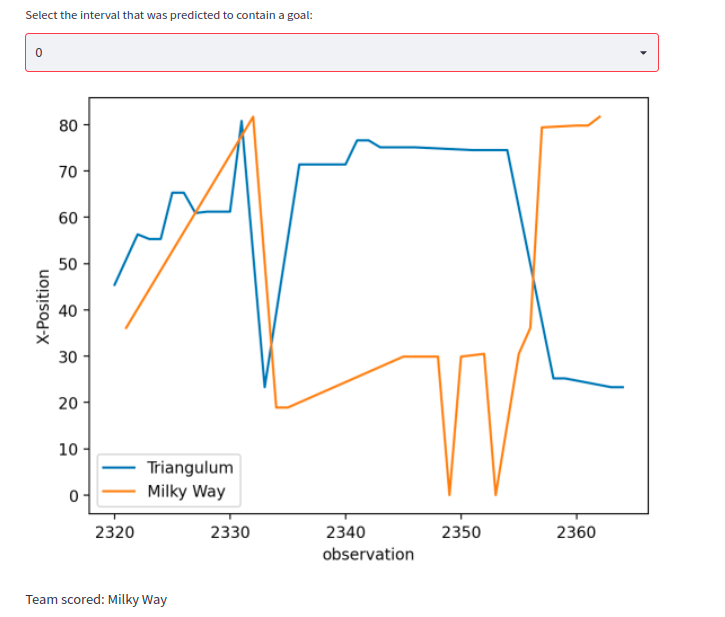
Simple methods like using the mean or median of the X-Position and predicting the team with the higher value as the attacker only gave an accuracy of ~ 70%.
Hence I resorted to a ML-Approach. The features Team-Name and the X,Y-Position for each observation in the time-intervall were used. All of these observations were concatenated in a single row, with a maximum set to 40 observations. This gave me 40*3 columns as features. For the target I noted the team that had scored. I generated the features and the target for all of intervalls that contained a goal. I then used a catboost-classifier to predict which team had scored the goal. The classifier reached a reasonable performance of 97% accuracy.
3. Predict the probability for home-win, draw and away-win.
The catboost-model gives us for each goal that has been scored the probabilities for each team. Simply using the max and predict that as the winner yielded a very poor score on the leaderboard. What worked better was performing monte-carlo-simulation. Essentially I did the following:
Given is a game a number of goals and a list of probabilities for the home-team to have scored each of the goals. I can use the binomial-distribution to simulate one trial essentially simulating if a goal has been scored or not. If the outcome of one trial is positive, home-team scores otherwise away-team. I can do this process for all goals. Doing this for all goals is one trial. At the end of the trial I can determine the outcome, home-win, draw or away win for that specific trial. This process is repeated 100_000 times and the mean is taken. This is the predicted probability.
The code for the simulation:
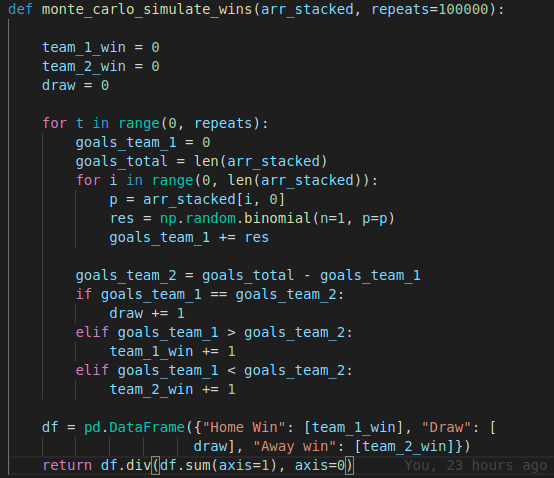
arr_stacked has the shape (number of goals, 2) where the columns are the probabilities for each team that it has scored.
Admittedly a better approach would be to simply calculate the probabilities combinatorically instead of doing this simulation. However I ran out of time, at the end of the competition and this approach was quick to implement ;).
4. Blend with a model that only takes as input the non-stats-part of the data.
Credit goes to @Mkmworld as I took his Baseline Approach (publicly shared in the Discussions) for the blend.
very nice, thanks for sharing
Thank you for sharing.
I followed a similar approach, but your approach is far better than mine in some of the steps, most obvious being your step 1 where you use 2 lines to go to where I got after Feature Engineering, Keras and more to get to the same point.
To be honest I had a much more complex approach at first too. Then I wanted to add some more features and stumbled accross this feature a day before the competition was closing. So I guess it was kind of lucky of me to find this feature ;).
Would love to see your code for the Monte Carlo stimulation, Great solution
Thankyou. I have added a screenshot of the code to the coresponding section in my post.