
Next-Gen WiFi Throughput Prediction Challenge by ITU AI/ML in 5G Challenge
The dataset contains several entries for different deployments, i.e. varying the device’s position and including the RSSI matrices and the list of the subset of random scheduled APs for each of them.
Description of the scenario
The figure below shows the scenario used for the simulations. It consists of nine access points (APs) and a variable number of stations (STAs). For each deployment, between one and five STAs are associated to each AP. All APs are located at the center of a subarea of 10x10 meters, and STAs are placed uniformly at random in the corresponding subarea and associated to the nearest AP.
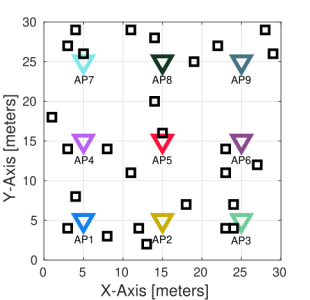
All APs are set to operate in the same channel, so they are overlapping. We consider only download traffic, and APs are able to transmit simultaneously using coordinated spatial reuse (c-SR) scheme [1-4]. The next figure shows an example of the employed transmission model.
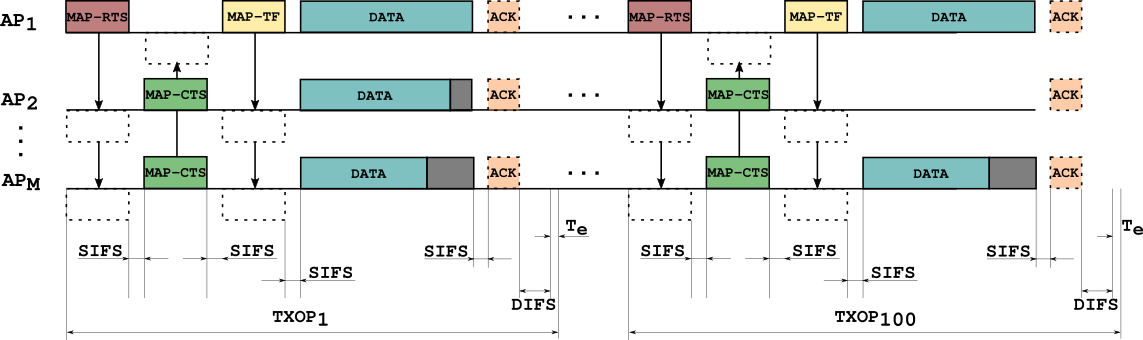
At every transmit opportunity (TXOP), the number of APs selected to cooperatively transmit is a random number between one and four, and also which APs and STAs are randomly selected. Thus, the power received at the stations (RSSI) is stored in a matrix for all the AP-STA links - this is called an RSSI matrix. As simultaneous transmissions are allowed, the quality of the received signal (signal-to-interference-plus-noise ratio or SINR) at the receiver is influenced by the RSSI of the desired transmitter, as well as the potential interferer. MAP-RTS and MAP-CTS are used to reserve the channel and MAP-TF is useful to exchange information between the coordinated APs.
Dataset and resources
The dataset is split into 10 000 files, each containing information about one deployment. At every deployment, the number of stations as well as their positions are randomly generated. Once the scenario is generated, APs start transmitting and they are randomly selected for all TXOPs (100 TXOPs per deployment).
The training files include the information of each deployment as follows:
- Header line, indicating the number of the deployment, e.g., Deployment 1.
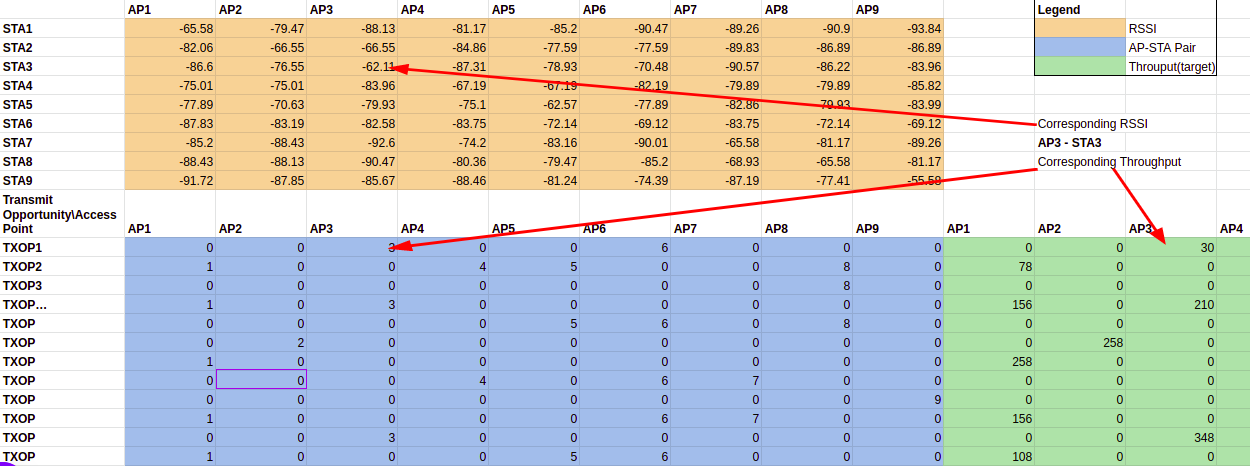
- The next rows contains the RSSI matrix. Values are in decibels (dB). The size of this matrix is NxM, where M is the number of APs (set always to 9) and N is the number of STAs randomly selected for this particular deployment.
- Then the information about each TXOP appears. In each row, the first 9 columns indicate the AP-STA pairs, e.g., 2,0,0,0,0,0,0,0,27 means AP1 (because the number 2 is on the first position which corresponds to AP1) transmits to STA2 and AP9 transmits to STA27. No other AP transmits, so it is represented with zeros. Then the values of throughput (in Mbps) referred to this particular TXOP are given behind, e.g., 108,0,0,0,0,0,0,0,54 where 108 and 54 are the corresponding value AP1-STA2 and AP9-STA27, respectively, in the example above.
In some cases, when the value of SINR at the receiver is under certain threshold, the STA is unable to decode the received frame without errors, so the value of throughput is considered equal to zero. Thus, in the example above if STA27 were unable to decode the frame properly, its throughput would have been set to zero, and the entire row would be: 2,0,0,0,0,0,0,0,27,108,0,0,0,0,0,0,0,0. The figure below shows an excerpt of a deployment.
To prepare the train and test file to be in the format for submission you can use the following code:
def read_csv(path):
csv_id = path.split('.')[-2].split('-')[-1]
rows = []
with open(os.path.join(data_path, path), 'r') as file:
csvreader = csv.reader(file)
for row in csvreader:
rows.append(row)
df = pd.DataFrame(rows)
df = df.apply(pd.to_numeric)
df.columns = ['AP'+ str(i) for i in range(1, 10)] + ['TP'+ str(i) for i in range(1, 10)]
sta, txop = df.iloc[:-100, :], df.iloc[-100:,:]
sta = sta.set_index('STA' + str(i) for i in range(1, sta.shape[0] +1))[['AP'+ str(i) for i in range(1, 10)]]
txop = txop.set_index('TXOP' + str(i) for i in range(1, 101))
mer_df = pd.concat([sta, txop])
mer_df['Deployment'] = csv_id
tp = txop[['TP'+ str(i) for i in range(1, 10)]]
txop = txop[['AP'+ str(i) for i in range(1, 10)]]
txop = txop.unstack().reset_index().rename(columns={'level_0': 'AP', 'level_1': 'TXOP', 0: 'STA'})
txop.STA = ['STA' + str(int(x)) for x in txop.STA]
txop['ID'] = txop.apply(lambda x: '_'.join([x.TXOP, x.AP, x.STA]), axis =1)
tp = tp.unstack().reset_index().rename(columns={'level_0': 'TP', 'level_1': 'TXOP', 0: 'Target'})
txop['Target'] = tp.Target
ref = txop[['ID', 'Target']]
ref.ID = ['Deployment'+str(csv_id) + '_' + x for x in ref.ID]
return [mer_df, ref]