
Chart of the Week - 14 July 2022
Connect · 14 Jul 2022, 08:44 · 0
Happy Thursday!
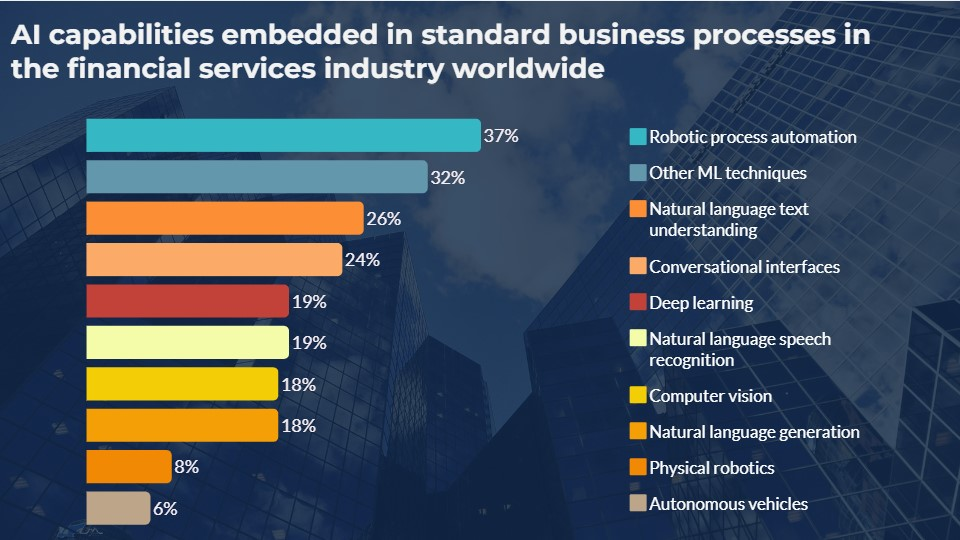
This Chart of the Week is based on information from the infographic on how finance uses AI at Raconteur. The data for this graphic is from Stanford University in 2021.
We notice that Robotic process automation is at the top of this chart, Deep learning about halfway down the list, and Autonomous vehicles at last place.
A few questions come to mind, two of which are:
- Do you think that any of these capabilities will replace robotic process automation any time soon or will it still take some time?
- What other capabilities not listed here (or maybe listed in the Other category) deserve to be listed separately amongst the others?
Discussion 0 answers