When working on a machine learning project, choosing the right error or evaluation metric is critical. This is a measure of how well your model performs at the task you built it for, and choosing the correct metric for the model is a critical task for any machine learning engineer or data scientist. Area Under Curve, better known as AUC, is used as an error or evaluation metric when evaluating a binary classification model built on a balanced dataset.
How to use evaluation metrics
For Zindi competitions, we choose the evaluation metric for each competition based on what we want the model to achieve. Understanding each metric and the type of model you use each for is one of the first steps towards mastery of machine learning techniques.
AUC as an evaluation metric
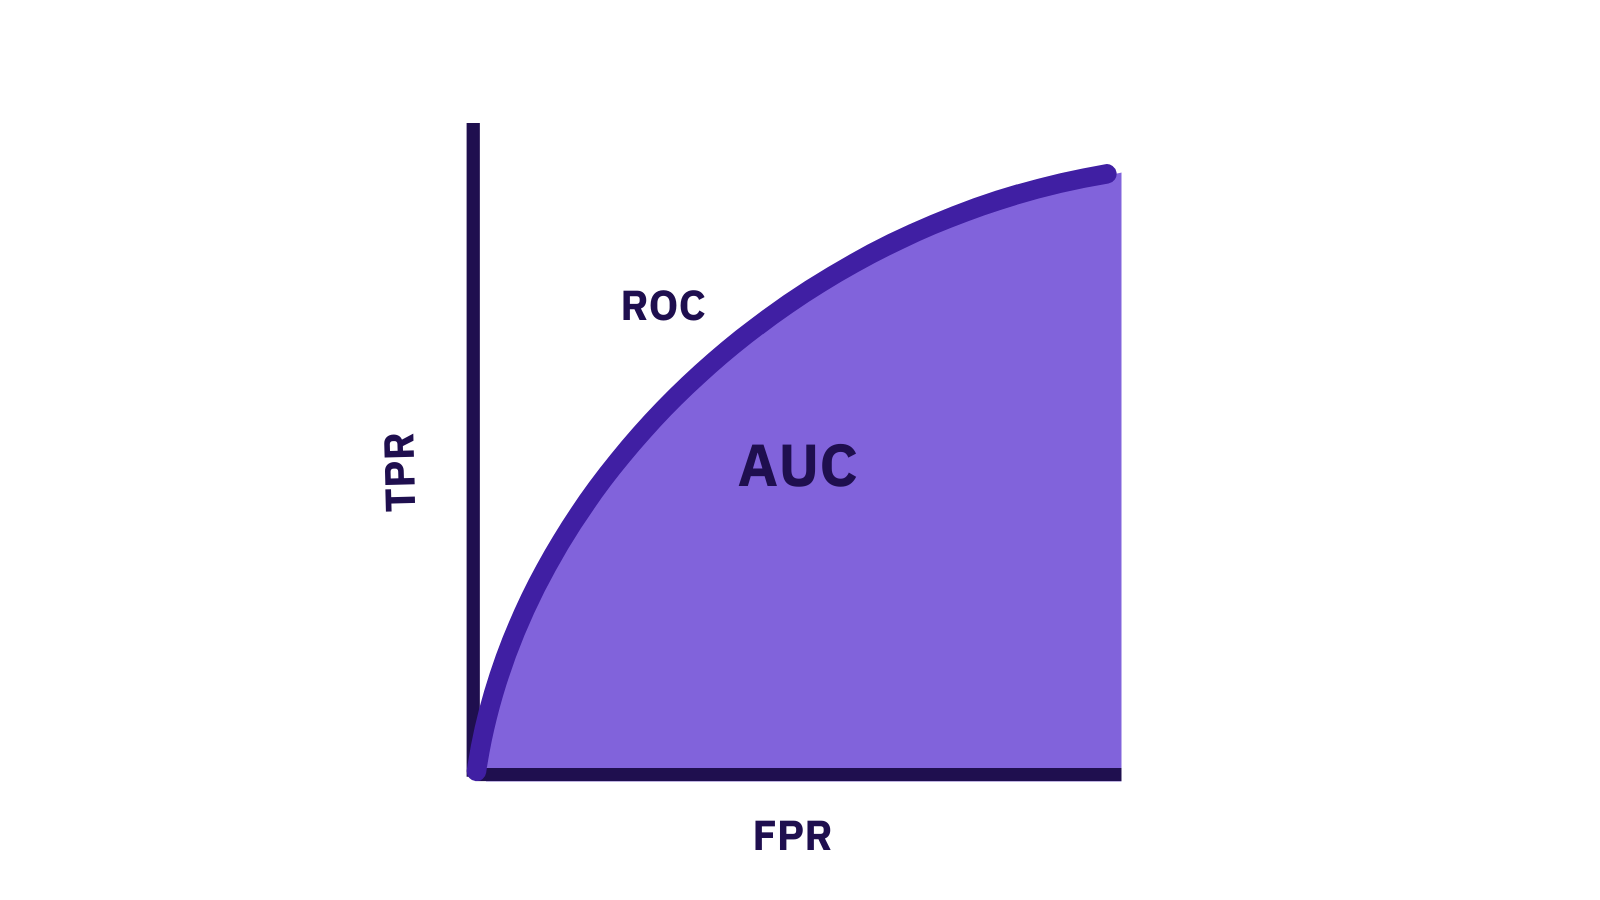
To understand Area Under the Curve we first need to understand the ROC curve (receiver operating characteristic curve). This plots two parameters: True Positive Rate (TPR) and False Positive Rate (FPR).

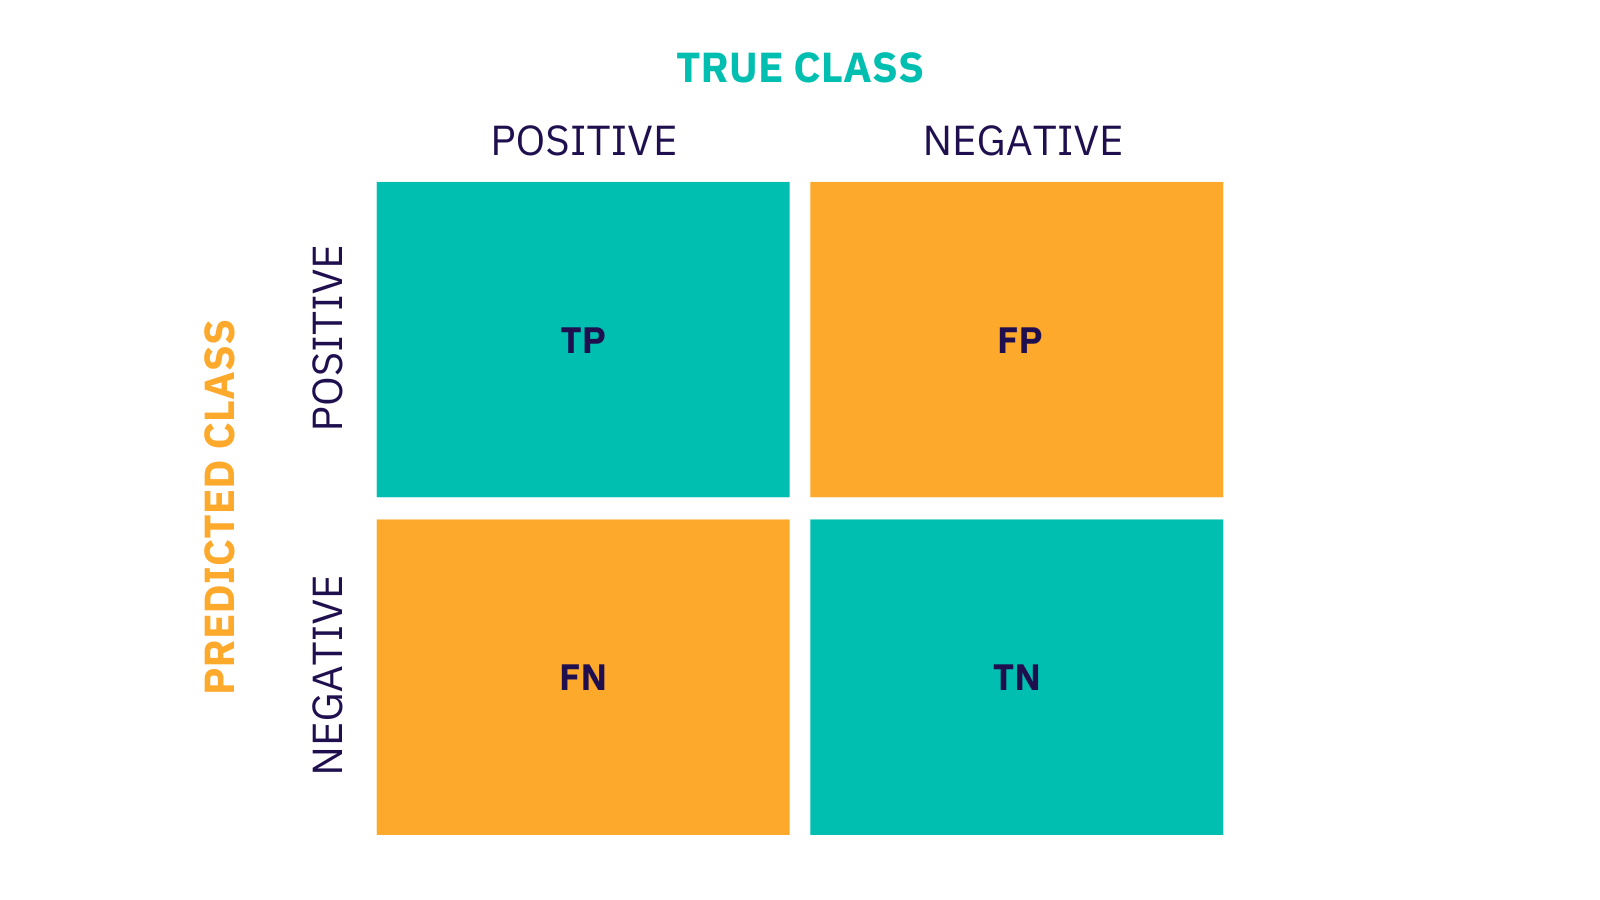
A quick recap on the acronyms we will be using:
TPR is also referred to as recall. It tells us the proportion of classes we got correct and is calculated as
TPR =TP/(TP+FN)
FPR, tells us the proportion of classes we got incorrect. It is defined as
FPR = FP/(FP+TN)
A ROC curve plots TPR vs FPR at different classification thresholds. A perfect ROC is on that predicts all TP and TN correctly.

The second part we consider is the Area Under the Curve (AUC). Think back to calculus: this is just the area under the curve and we want to maximise this (get as close to 1 as possible).
When 0.5 < AUC < 1, this means you are predicting more classes correctly and you are heading in the correct direction.
With this knowledge, you should be well equipped to use AUC for your next machine learning project.
Why don’t you test out your new knowledge on one of our knowledge competitions that uses AUC as its evaluation metric? We suggest you try out the Road Segment Identification Challenge in our Knowledge section.
Its a fair explanation
fair enough
it is clear
clear
A good explanation of the concept