
Adaptation Atlas Data Storytelling Challenge (Track 1): Water Security, Agriculture and Health
Helping Africa
$1 500 USD
Completed (8 months ago)
Data visualisation
Data storytelling
Data analysis
Python
Javascript
Observable
HTML
Markdown
361 joined
30 active
Start
Sep 05, 25
Close
Nov 03, 25
Reveal
Dec 08, 25

Generated HTML is empty?
Notebooks · 21 Sep 2025, 14:07 · 8
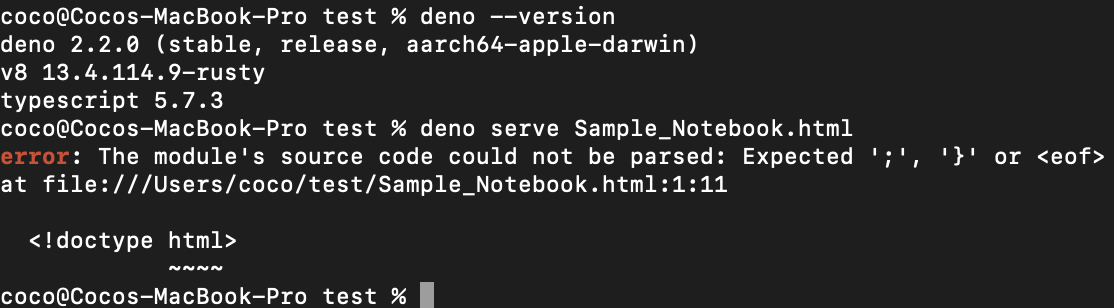
After following the tutorial, I used Deno 2.2 to generate the notebook.html. However, I used Chrome browser to open this html, the page is empty. The same thing happened to Sample_notebook.html.
Is it supposed to be empty? Then how can we check and see this static html page? ( I also tried to use 'deno serve Sample_Notebook.html' command, then it will cause error).
Hi @coco2020,
Strictly speaking what is generated is a not proper HTML document because there are <!doctype HTML> and <html></html> tags. However the generated document has the structured of an HTML documents. Trying to display the converted notebook in your browser will give a blank page. However if you open it in an editor or inspect code in the browser, you will notice that the document is not actually empty. For reference review the attached Sample Notebook.
Thank you for your reply, @AJoel. Then what's the purpose of converting the notebook to a static HTML and how do the judges check it on their end if they can not open it in the browser?
Hi @Coco2020. I believe converting the notebook to a static HTML happens after you have done your work and visualisations on the ObservableHQ notebook. This is the final step before uploading same
How does one arrange the analysis on the notebook and are there other datasets one can access?
Hi @anyibaba, that's logically the last step, though I'm following the given instructions and testing the setups.
You could try the second video in the 'Info' section for some descriptions of the notebook, and you can find the datasets under the downloadable pdf file under the 'Data' section.
Thank you.
Ok. It seems better to download the notebook and work from there right?
Rendering the graphics from the Observable HQ url is slow at my end
Really? I tried to load a big dataset and there is a limit to upload too large data, so no opportunity to render them. You can check with the staffs and see their suggestions.
It's true the output isn't a full HTML doc with doctype and html tags. But the structure is HTML-like. A blank browser page is expected. Inspect the code though! You'll see content exists, much like hidden gems in a block blast . The Sample Notebook shows this clearly. Think of it as finding hidden pieces in block blast to reveal the whole picture.
Great initiative! This is a critical area to explore. Seeing the impact of water insecurity on agriculture and health really highlights the need for innovative solutions. Reminds me of the quick-thinking needed in Drift Boss Data visualizations are powerful here. Could we explore regional variations in water management practices and their correlation with health outcomes further? Perhaps including case studies of successful adaptation strategies would be beneficial. #WaterSecurity #Agriculture #Health #DataStorytelling