
Digital Green Crop Yield Estimate Challenge
'%3e%3ccircle r='20' fill='%23008'/%3e%3ccircle r='17.5' fill='%23fff'/%3e%3ccircle r='3.5' fill='%23008'/%3e%3cg id='d'%3e%3cg id='c'%3e%3cg id='b'%3e%3cg id='a' fill='%23008'%3e%3ccircle r='.875' transform='rotate(7.5 -8.75 133.5)'/%3e%3cpath d='M0 17.5.6 7 0 2l-.6 5L0 17.5z'/%3e%3c/g%3e%3cuse xlink:href='%23a' transform='rotate(15)'/%3e%3c/g%3e%3cuse xlink:href='%23b' transform='rotate(30)'/%3e%3c/g%3e%3cuse xlink:href='%23c' transform='rotate(60)'/%3e%3c/g%3e%3cuse xlink:href='%23d' transform='rotate(120)'/%3e%3cuse xlink:href='%23d' transform='rotate(-120)'/%3e%3c/g%3e%3c/svg%3e)

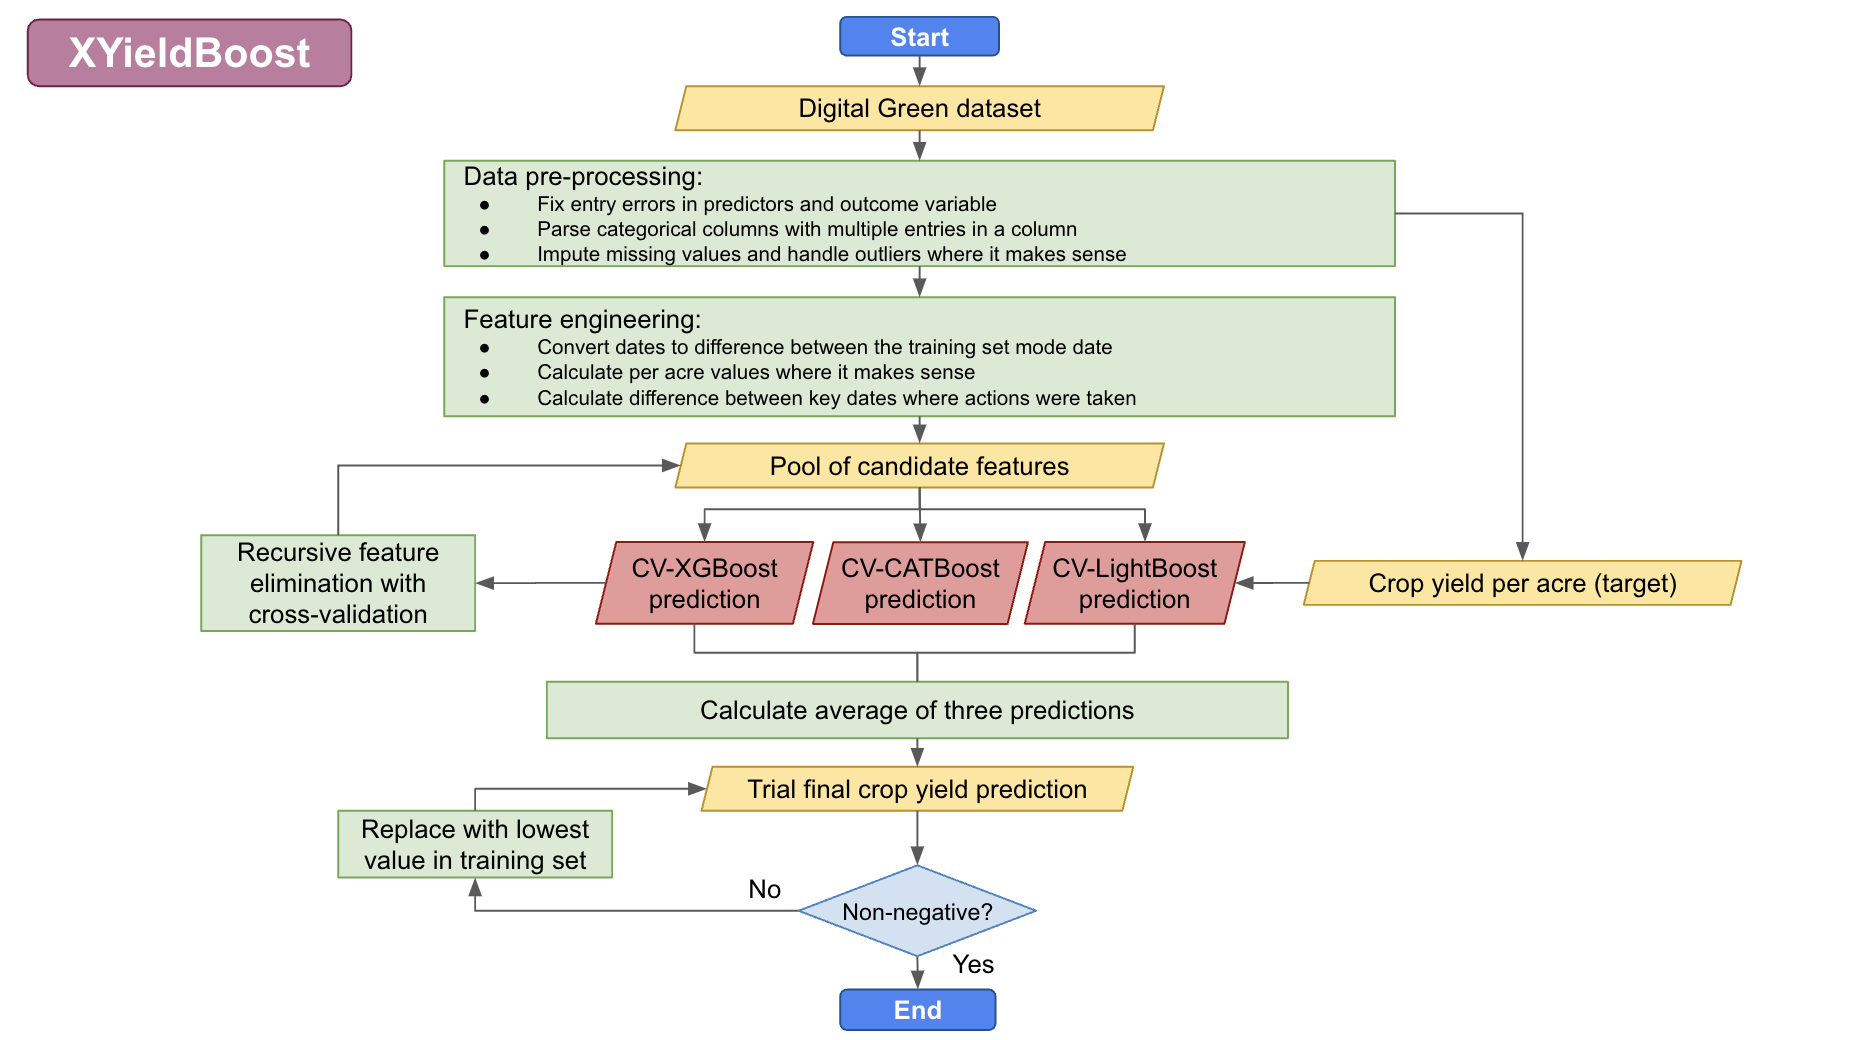
Hello! We finished 3rd on the final leaderboard. We've made all our code and methodology for our model – which we have called XYieldBoost – available here.
We used an ensemble method that took the average of three predictions made using tree-based methods, specifically: XGBoost, CatBoost, and LightGBM. All three of these are tree-based methods, which are great for handling tabular data with non-linear relationships. We also used cross validiation to train and test our model in order to reduce overfitting.
However, I think the most important part was the data cleaning stage. We probably spent 95% of the time on data cleaning, which involved working to understand the variables and reading literature on which variables affect crop yield in Bihar/India. As a result, we learned about different agircultural traditions in North Bihar vs. South Bihar (which is more agriculturally productive and employs the Ahar Pyne agricultural system, leveraging channels and retention ponds to manage water resources and adapt to Bihar’s unpredictable weather). We also learned about the importance of the monsoon in Bihar agricultural cycles. Kharif crops, such as rice, are sown during the monsoon season from June to September and are watered by monsoon rainfall. These crops do well with high rain in Winter. Rabi crops, such as wheat, are sown in mid-November – preferably after the monsoon rains are over – and are watered by percolated rainfall. These crops are spoiled by high rain in winter. We also learned about nitrogen cycles, fertilizer application methods, and irrigation techniques.
With all of this information, we had a pretty good idea that the region in which the crops was grown was important (North vs. South Bihar), as were the various dates on which key agricultural steps were taken, as were the fertilisation choices. We engineered our data to reflect this, and selected the top variables using recursive feature elimination with cross validation.
Overall, we only spent around 5% of the time building the actual model (and only started fine-tuning the model two days before the deadline). The trick is to understand the data and not overfit to the public test set :)
We also took additional steps to ensure that the end user of the data (Digital Green) will be able to make as much use as possible from our results. To provide them with additional insights, we calculated Shapley values for each variable, which are the average expected marginal contribution of one variable after all possible combinations have been considered. These can be seen similarly to the variable importance indicators that can be extracted from random forest models.
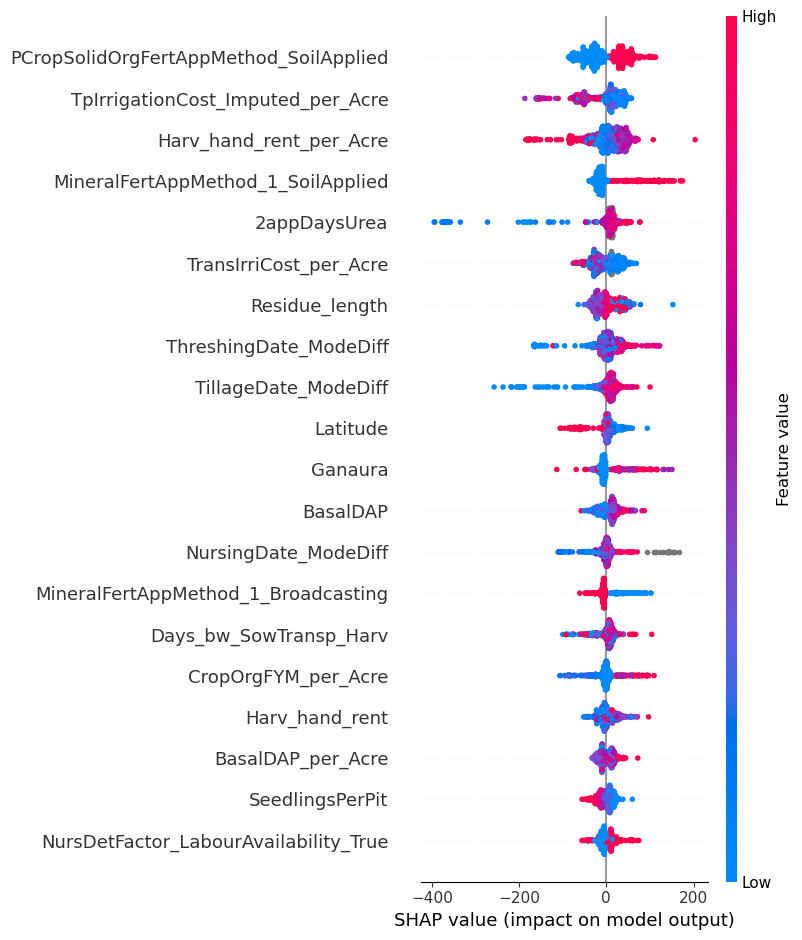
Digital Green may be able to leverage the information provided by the Shapley values to improve crop yield for Bihar farmers. For example, as seen in the above plot, applying organic fertiliser directly to the soil in the previous crop cycle was very consistently associated with higher yield per acre. It might then be worthwhile for Digital Green to spread this information to farmers, or possibly even invest in directly giving them fertilisation tools that enable direct soil application.
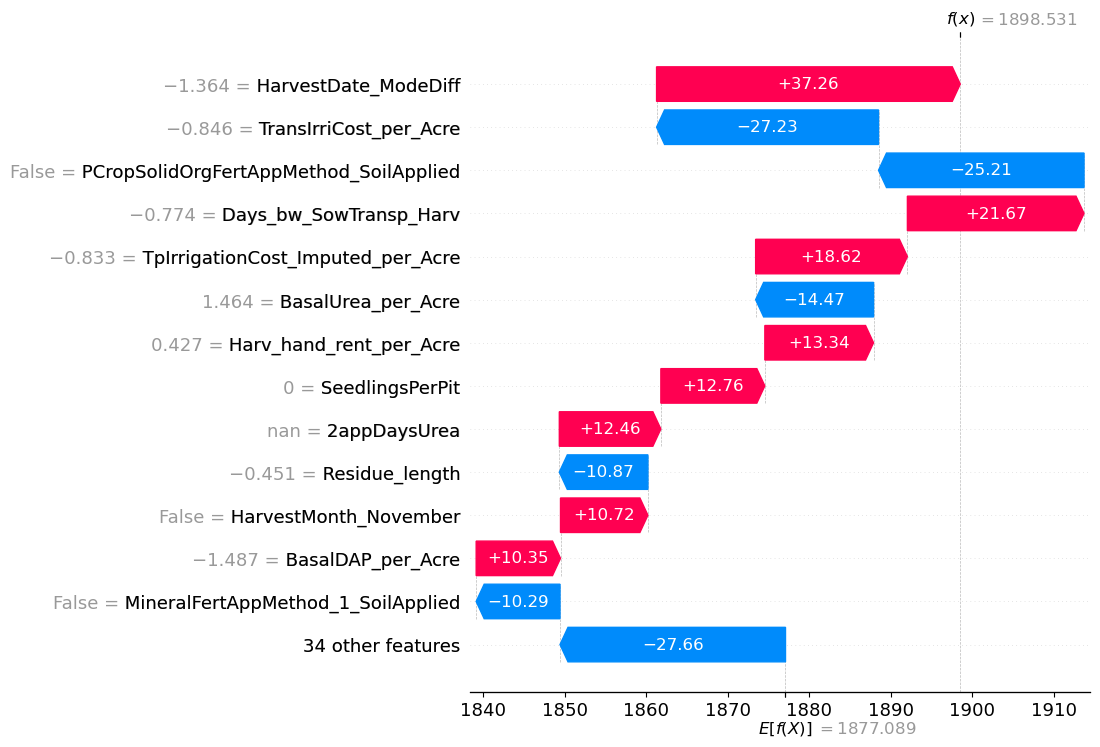
We also developed methodology that will enable Digital Green to determine exactly which factors are driving specific predictions for a given plot of land. The above plot shows which variables influenced the prediction for ID_1YX1Q0KU8H4J, a 0.375 acre farm in the small town of Noorsarai in the Nalanda district of Bihar. This farmer harvested his crop on October 20th, 2022 – earlier than other farmers in the sample. Typically, Kharif crops such as rice are harvested at the end of monsoon season (October–November). However, the 2022 monsoon was slightly drier than normal in Bihar. This might have meant that earlier harvesting would have prevented crops drying out due to the lack of accumulated monsoon rainfall. As can be seen in the above plot, choosing to harvest earlier was associated with an approximiate increased yield of 37 units per acre. However, this farmer also did not apply organic fertiliser to his soil in the previous crop cycle. Since this application method was very consistently associated with higher yield, our model estimated that this decision potentially reduced the farmer's yield by 25 units per acre.
Your work on agriculture in Bihar is impressive and insightful. It really highlights the importance of local agricultural knowledge in this competition.
Could you explain how these insights affected the final outcome? In my experience, I noticed worse results when I did complex data cleaning and feature engineering. I'm curious if you scored better with less data processing before the final submission.
We used recursive feature elimination with cross validation, which is a pretty good method for ensuring that useless and potentially harmful features are removed from the data while also allowing you to test a very large number of features.
As you can see in the first Shapley values plot, almost all of our most important variables were engineered features so this strategy definitely paid off :)
I think it's also important to use domain knowledge when building models, as having a reasonable idea which variables may be useful increases the probability that you will engineer useful features.
Can you say a bit more about your CV methodology? How did you handle outliers?
We did five-fold cross-validation for both evaluating our model performance and training our model, meaning we took the average of the five cross validation predictions as the final prediction instead of just using all the data to make one prediction.
For outliers in the predictions, we used domain knowledge as to what would be a reasonable value and set that as a cap. To ensure we weren't removing meaningful data, we created the capped variables in a new column and compared which column made better predictions using recursive feature elimination.
For outliers in the outcome variable, the first thing we did when we got the data was plot the relationship between yield and acre (shown below) as we weren't sure whether the yield values were given in absolute values or per arce values (they were actually absolute values), so we plotted the two. It was immediately clear that some of the values were not behaving as expected.
These values can be identified as they are outliers from the line of best fit between acre and yield. All the outliers we identified (in red below) had an error of over 1200 from the line of best fit. We originally considered deleting them from the training set, but then discovered that dividing them by 10 puts them right back on the line of best fit. So we divided their yield values by ten and left them in the training data.
Pretty neat approach and description! Solution description nicely reflects good understanding of the problem, domain-wise. Congrats and well deserved win!
Could you please explaing the "rescale_entry_errors" function in preprocessing step ?
It does what I describe in my reply to kkf above: basically there were entry errors in the Yield values where an extra zero was added to the end. We divided these by ten to solve the issue.
I really like the thought process and everything. So neat and through! Hello @rapsoj, can you turn this into an article and share it with @Zindi so that it can publish for the community to learn from it.