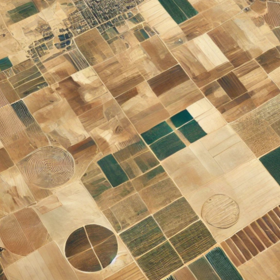
Am also wondering how🤔 and its pretty evident even from the visualizations that location alone can't determine whether cropland or not
1. Randomness in points e.g you find like 2 cropland points in the centre of like 15 no croplands.....meaning we can't conclude by saying the nearest labeled point to the test location will be our conclusion whether cropland or not...e.g..https://ibb.co/DfCQJ8yL
2. Even the closeness to a vegetation feature doesn't guarantee you to be a cropland or not.
3. Even the closeness to a water body doesn't guarantee a place to be cropland or not.
so leaving us with only one option to look for the sentinels as they are the what are used to determine whether cropland or not .......meaning that if we can't find the sentinels for the train locations we were given in order to train model on them, then even the sentinels for the test locations are of no use.
And another thing are the croplands labels, are they a representative of the whole 4 years period or is it as of 30th June 2025 when the last recordings were taken.
I went through your visualization @keystats, the truth is the test set location is masked. So it is useless to place them on the same plane with the train set. Do you get it? It is the sentinel information that actually tells the story. Finding data across time might significantly boost your score, since you have the different reflectance values of the same location over time.

I think they have given us the data. But for the training point I don't think so😅. I don't know how the top guys are doing it😂
Am also wondering how🤔 and its pretty evident even from the visualizations that location alone can't determine whether cropland or not
1. Randomness in points e.g you find like 2 cropland points in the centre of like 15 no croplands.....meaning we can't conclude by saying the nearest labeled point to the test location will be our conclusion whether cropland or not...e.g..https://ibb.co/DfCQJ8yL
2. Even the closeness to a vegetation feature doesn't guarantee you to be a cropland or not.
3. Even the closeness to a water body doesn't guarantee a place to be cropland or not.
so leaving us with only one option to look for the sentinels as they are the what are used to determine whether cropland or not .......meaning that if we can't find the sentinels for the train locations we were given in order to train model on them, then even the sentinels for the test locations are of no use.
And another thing are the croplands labels, are they a representative of the whole 4 years period or is it as of 30th June 2025 when the last recordings were taken.
I think you will have to manually get them from an open source dataset I guess. As of the time, look closely at the test set which specifies them.
Hello, what form of results need to be submitted for this competition, code or extracted results?
A csv file which contains your model's predictions on the test set.
I went through your visualization @keystats, the truth is the test set location is masked. So it is useless to place them on the same plane with the train set. Do you get it? It is the sentinel information that actually tells the story. Finding data across time might significantly boost your score, since you have the different reflectance values of the same location over time.