
The ARC Challenge: Africa

Hi everyone, this is my entry for the bonus prize! Lol, just kidding. But here's how you can get to explore the data yourself.
In the dataset, we've created another format which you may have seen. You can actually use that to understand the ARC if you've not read about it at all, you should https://arcprize.org/arc-agi
Did you know there's a viz app in the dataset created by François Chollet? With that out of the way, here's how to use it.
I will explore the case of test_0016, but note that if you're getting the popular error missing ids blah blah, it's just because test_16 is the first missing id, you're probably missing many others. You have to follow the sample submission format.
Let's see why the Sample Submission format makes sense.
1. Go to the dataset, I'm assuming you already downloaded it. unzip the second format.
 📷
📷2. Unzip the file, you'll see apps.
 📷
📷3. Enter into the app, ther's a nice html script you should just click on to open
 📷
📷4. It nicely opens on your browser. Use choose File (If you select Random, then you'll be using Chollet's Dataset.)
 📷
📷5. select the file you want to visualize. The test_0016 lives in the test_split folder
 📷
📷6. Find it
 📷
📷7. Opening it visualizes the problem.
 📷
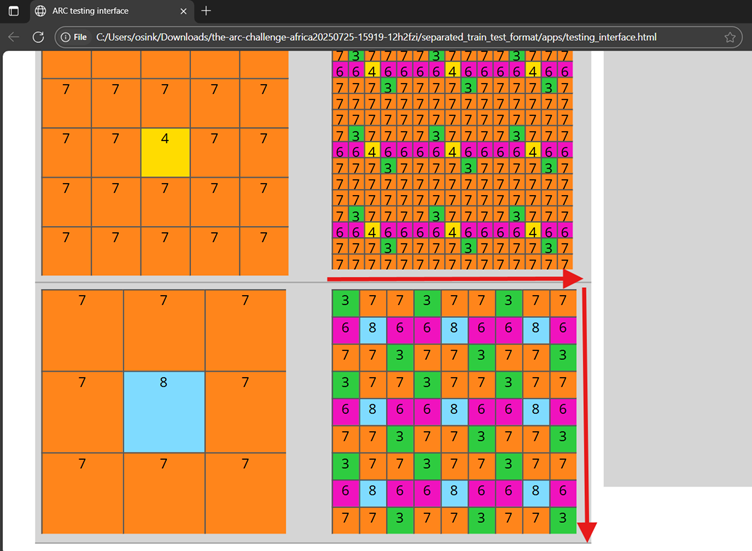
📷8. If you say show numbers, then you see where we're getting the numbers from.
 📷
📷9. Zoom in on the train side. I've not solved the puzzle but this clearly shows that an input grid of 3x3 is expecting a 9x9 grid, hence 9 columns (xxxxxxxxx), and 9 rows (test_0016_1, test_0016_2, test_0016_3, test_0016_4, down to test_0016_9)
 📷
📷Upvote if you loved this tip, or ask away if you don't understand anything.