Turtle Recall: Conservation Challenge
'/%3e%3c/defs%3e%3cpath fill='%23fff' d='M-120-80h240V80h-240z'/%3e%3cpath d='M-120-80h240v48h-240z'/%3e%3cpath fill='%23060' d='M-120 32h240v48h-240z'/%3e%3cg id='b'%3e%3cuse xlink:href='%23a' stroke='%23000'/%3e%3cuse xlink:href='%23a' fill='%23fff'/%3e%3c/g%3e%3cuse xlink:href='%23b' transform='scale(-1 1)'/%3e%3cpath fill='%23b00' d='M-120-24v48h101c3 8 13 24 19 24s16-16 19-24h101v-48H19C16-32 6-48 0-48s-16 16-19 24z'/%3e%3cpath id='c' d='M19 24c3-8 5-16 5-24s-2-16-5-24c-3 8-5 16-5 24s2 16 5 24'/%3e%3cuse xlink:href='%23c' transform='scale(-1 1)'/%3e%3cg fill='%23fff'%3e%3cellipse rx='4' ry='6'/%3e%3cpath id='d' d='M1 5.85s4 8 4 21-4 21-4 21z'/%3e%3cuse xlink:href='%23d' transform='scale(-1)'/%3e%3cuse xlink:href='%23d' transform='scale(-1 1)'/%3e%3cuse xlink:href='%23d' transform='scale(1 -1)'/%3e%3c/g%3e%3c/svg%3e)
Helping Kenya
$10 000 USD
Completed (over 4 years ago)
Classification
Computer Vision
757 joined
246 active
Start
Nov 19, 21
Close
Apr 21, 22
Reveal
Apr 21, 22

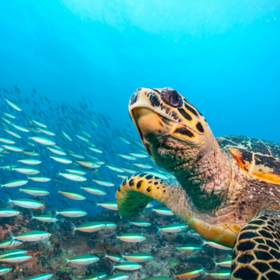
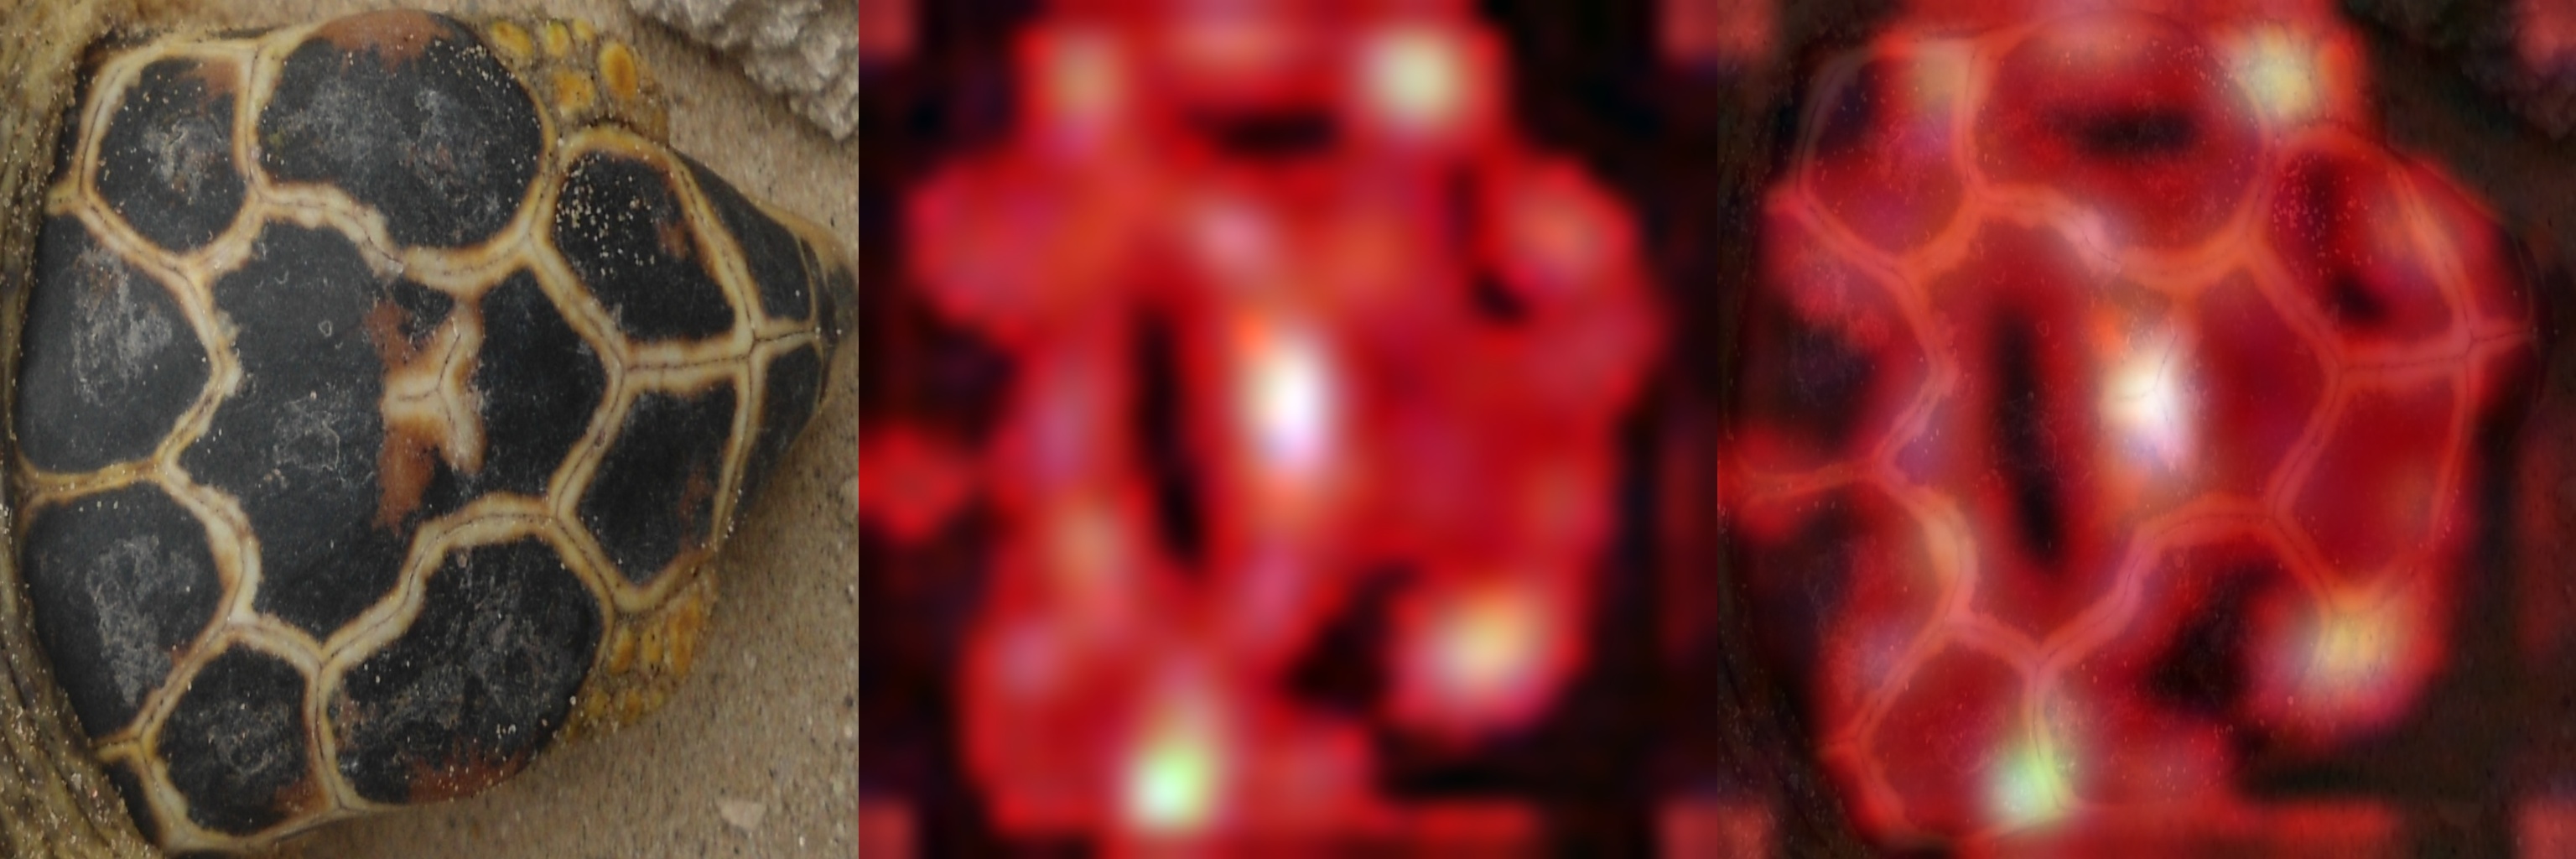
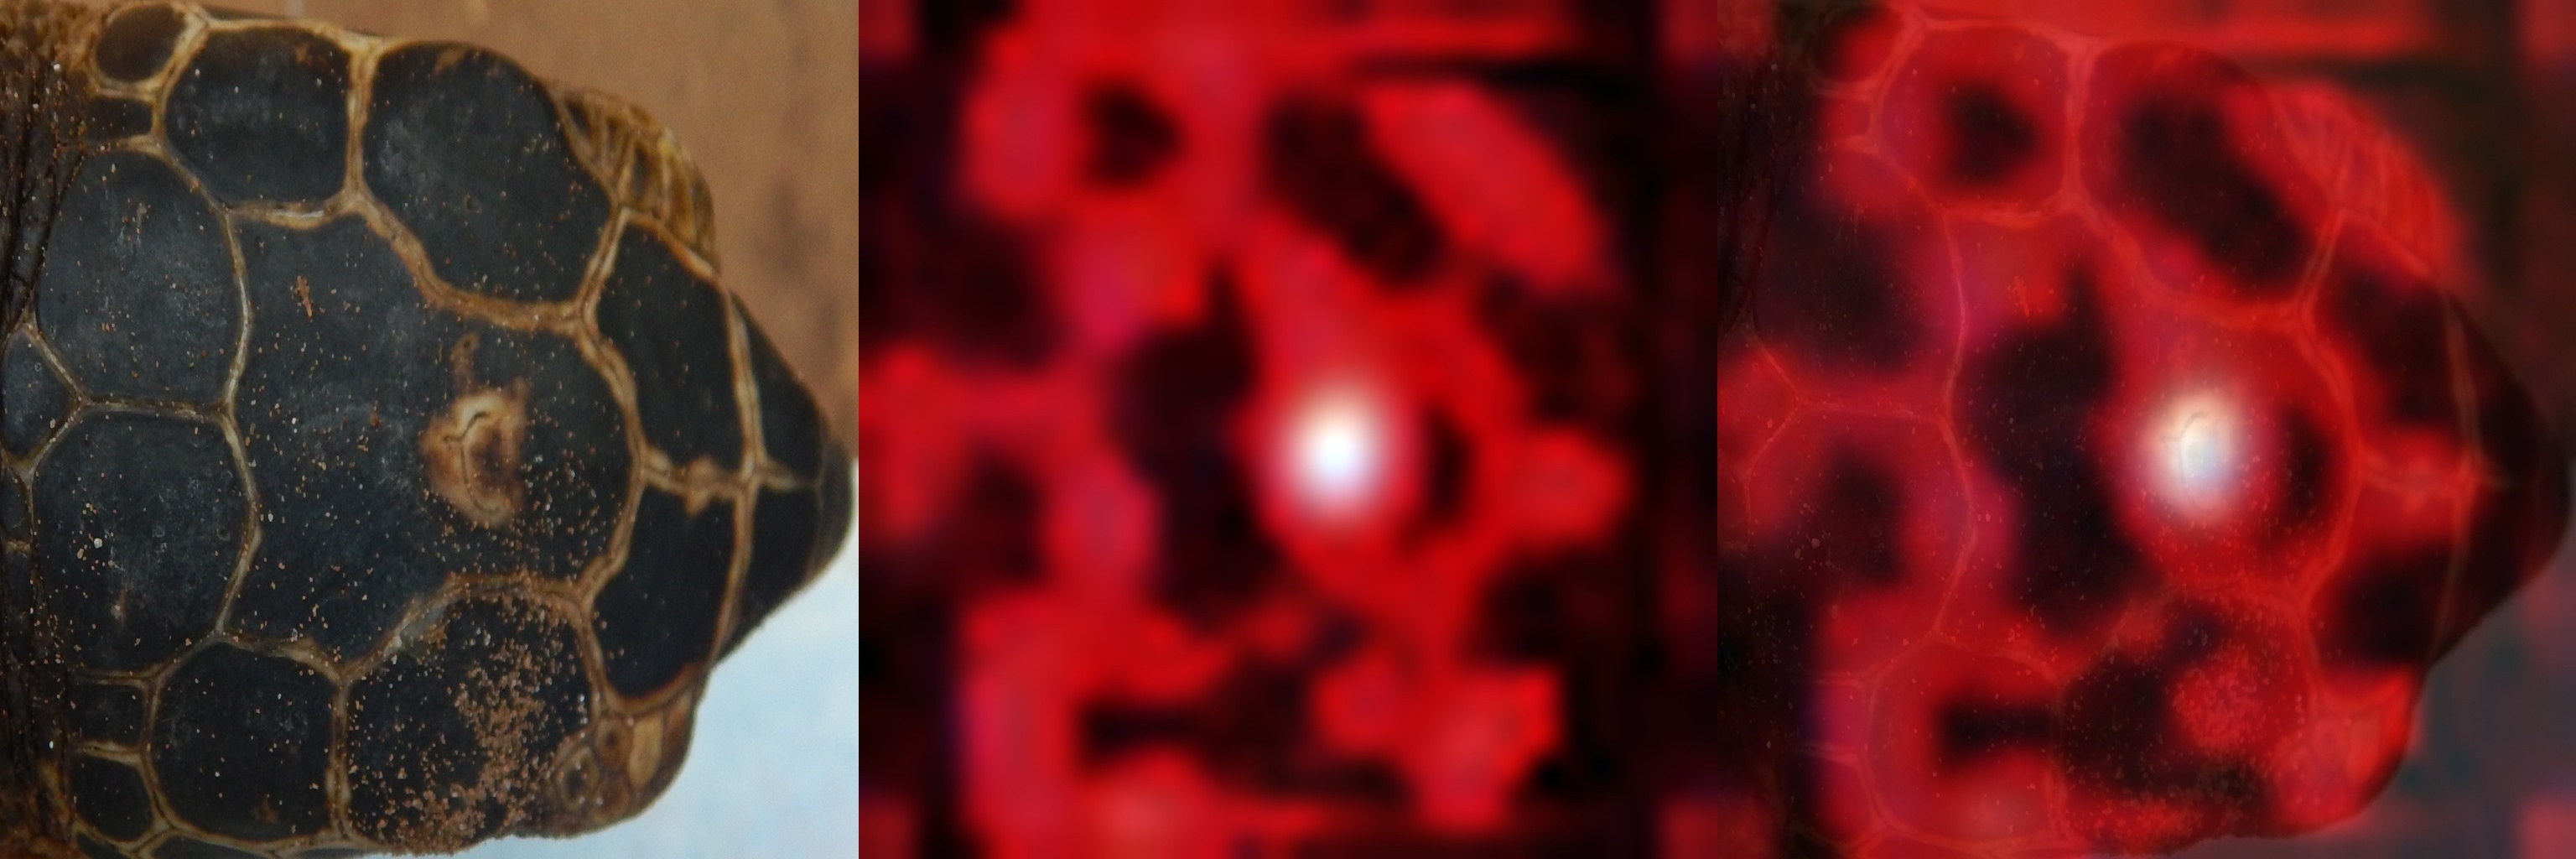
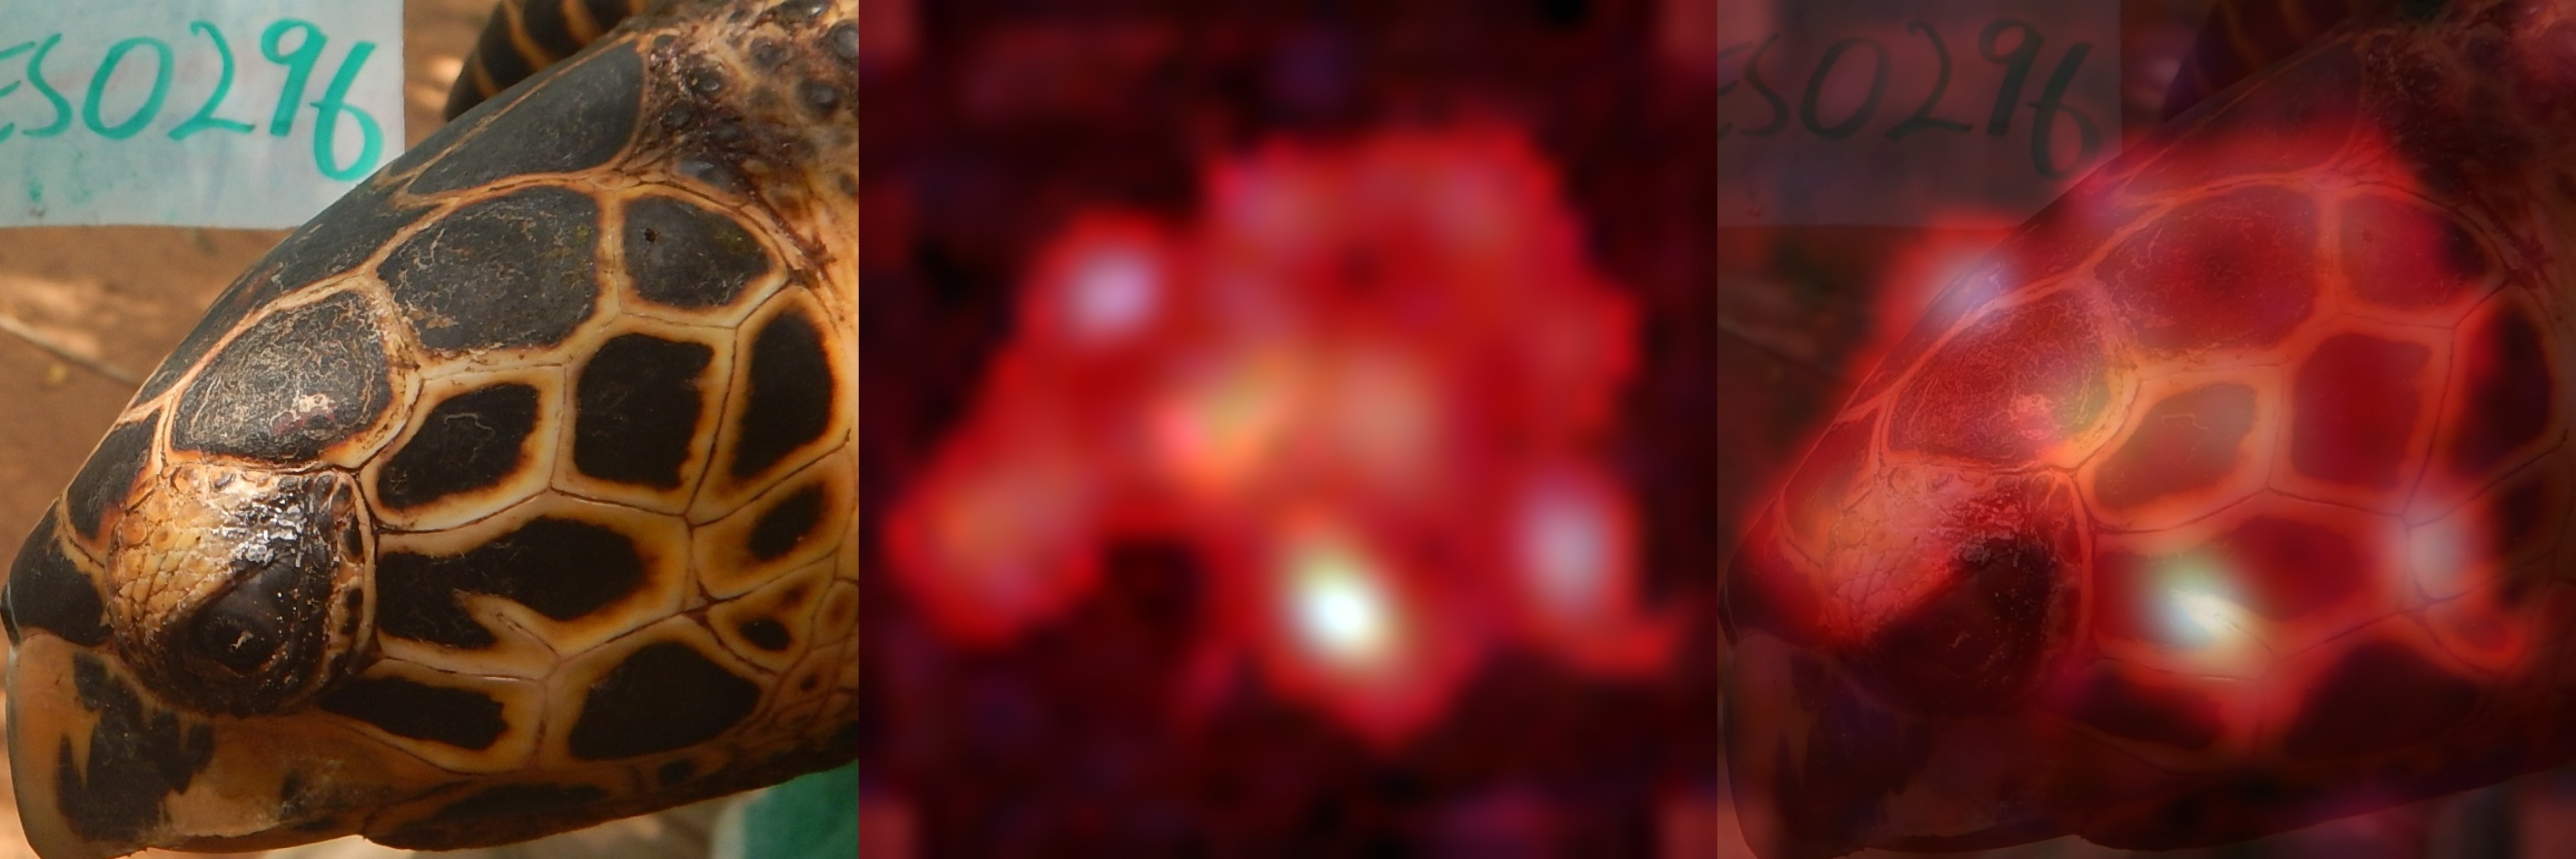
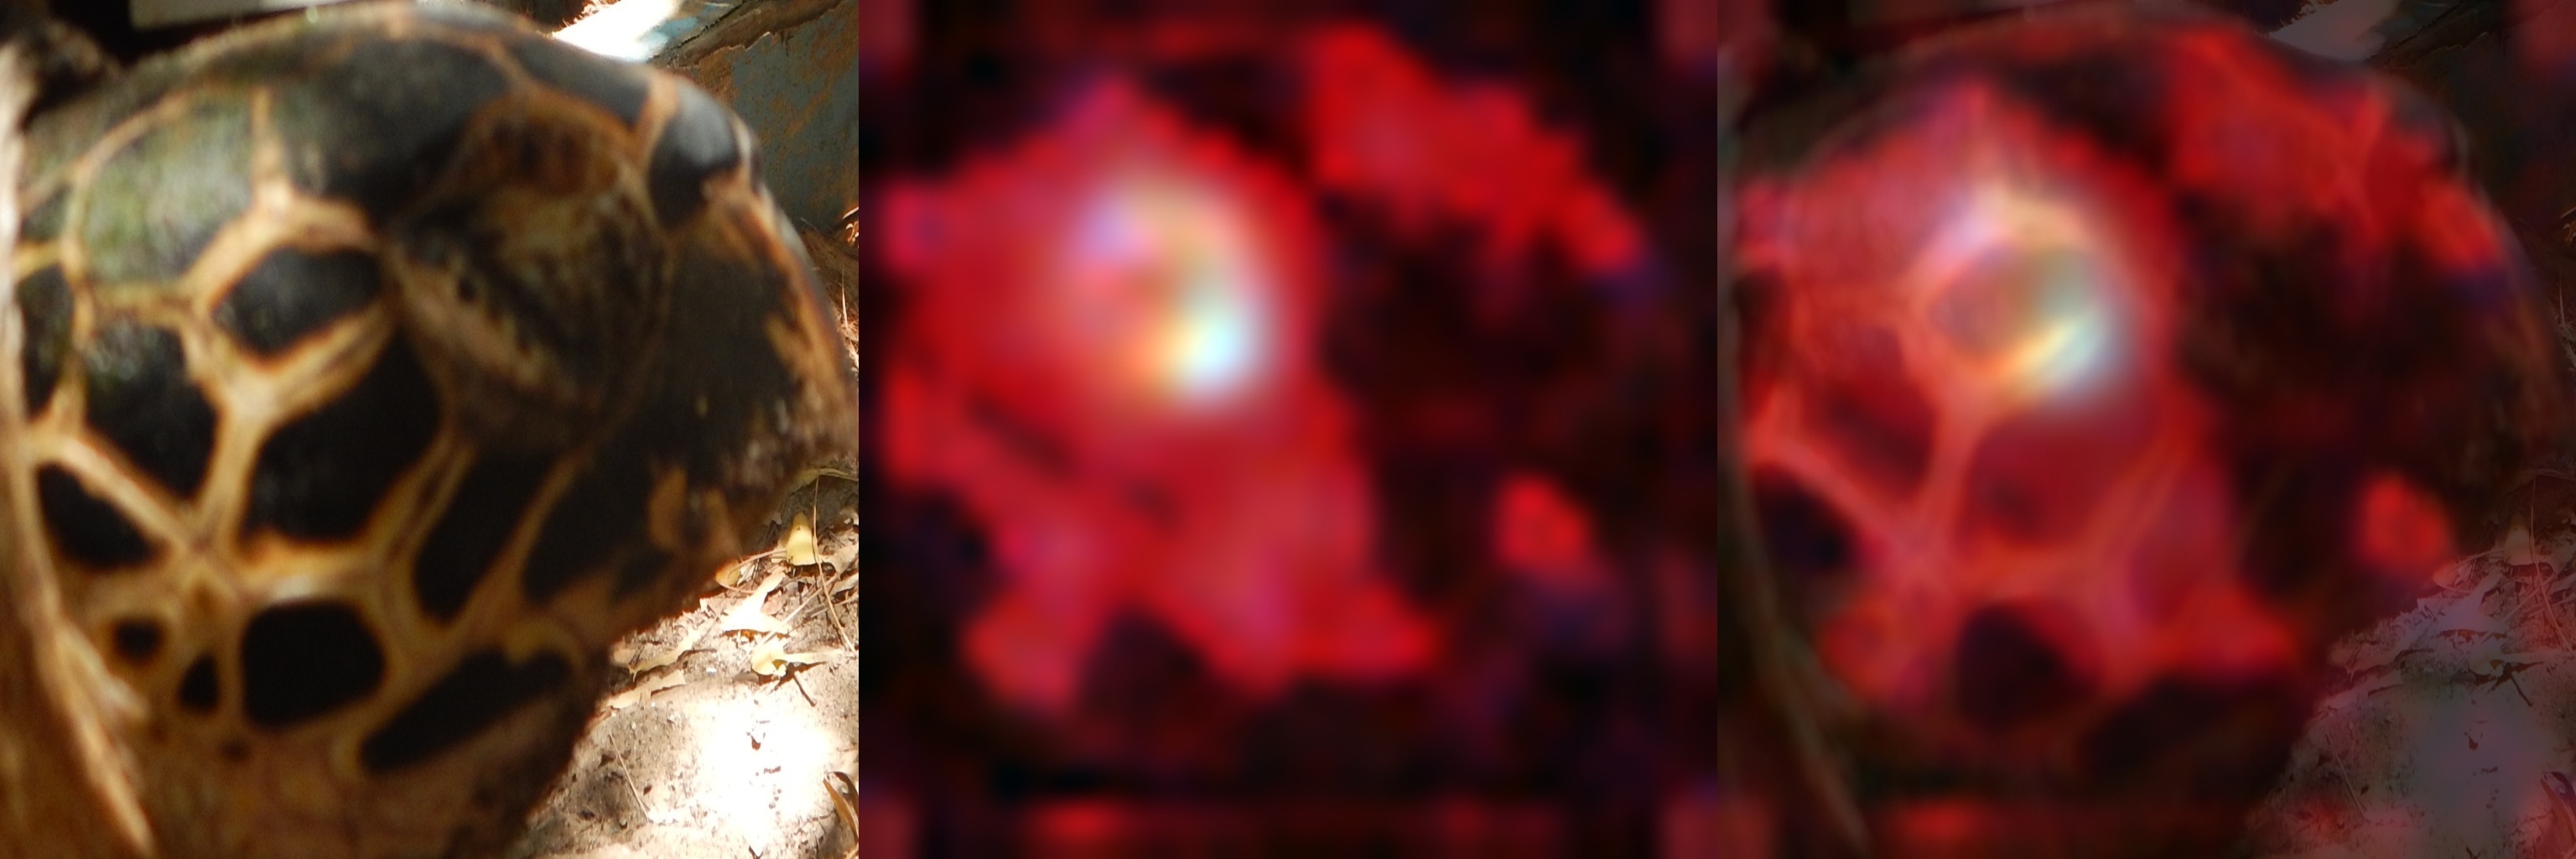
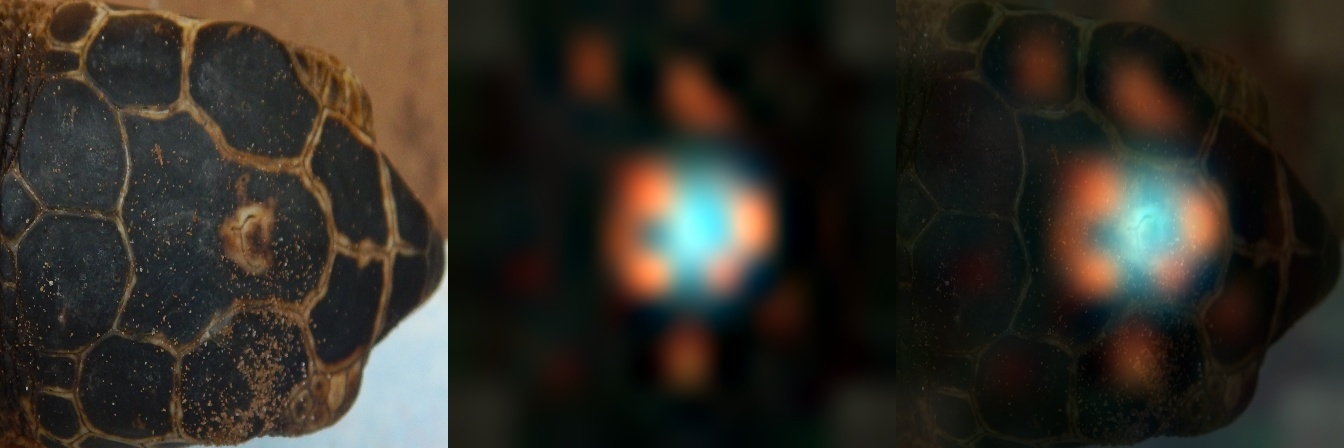
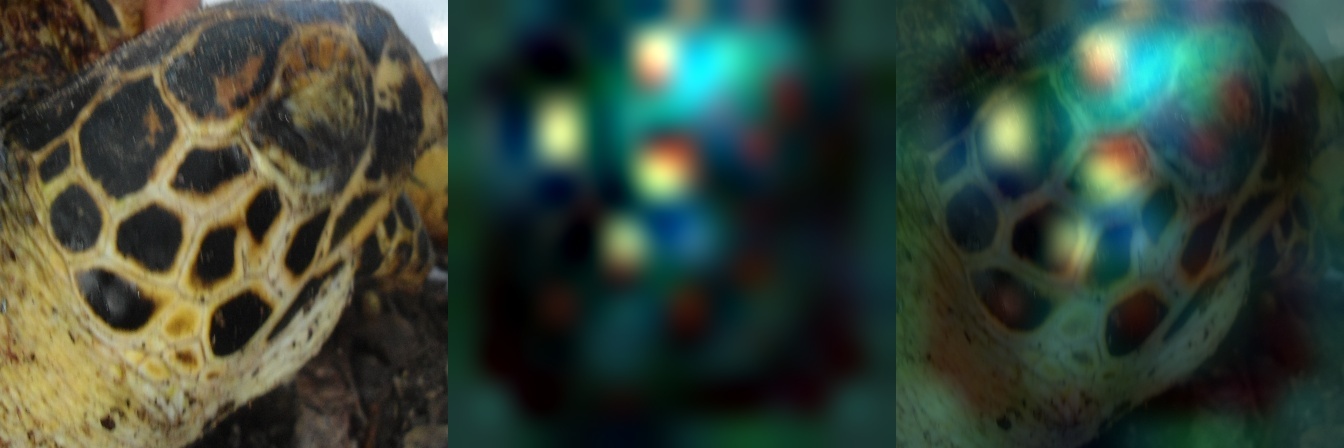
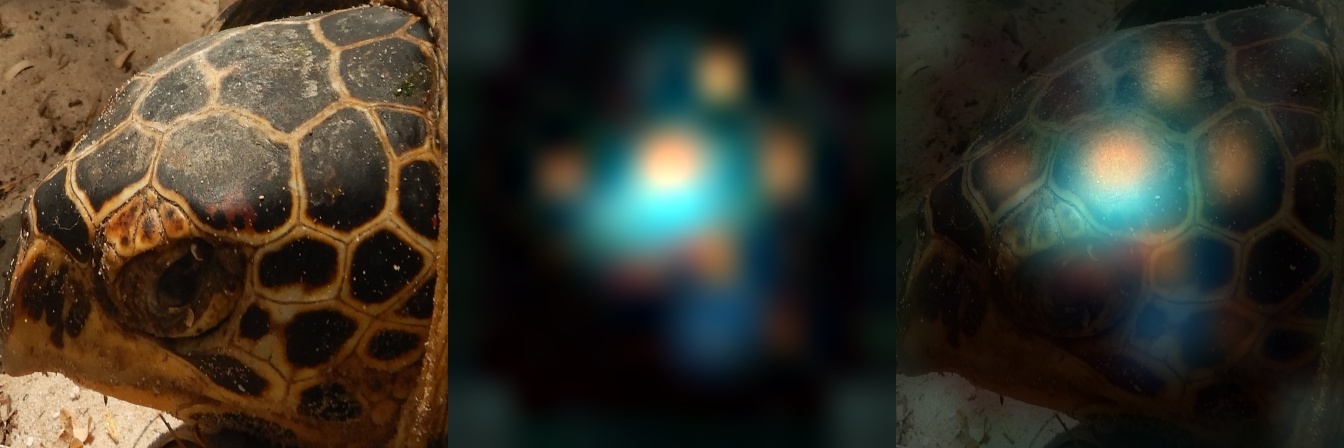
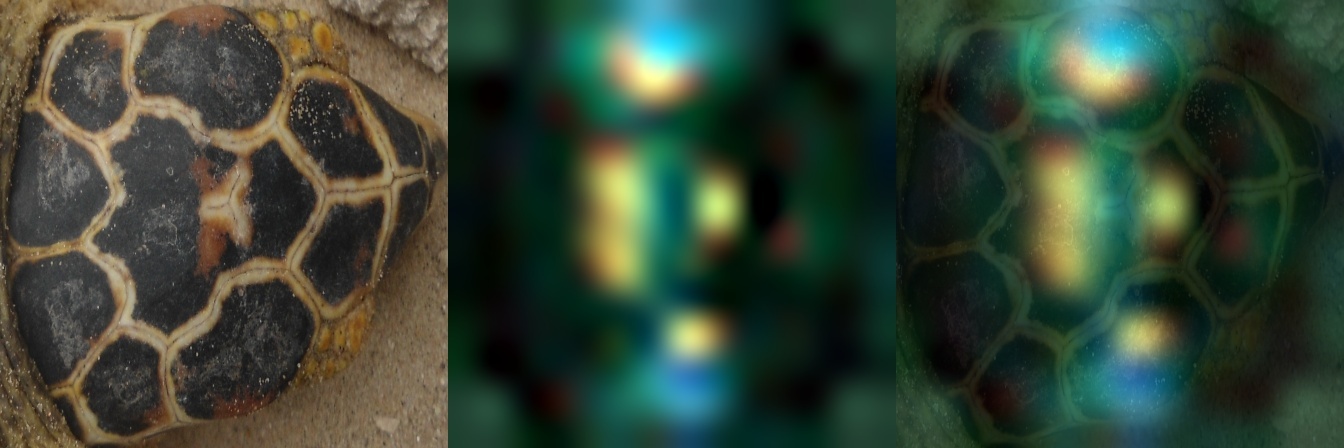
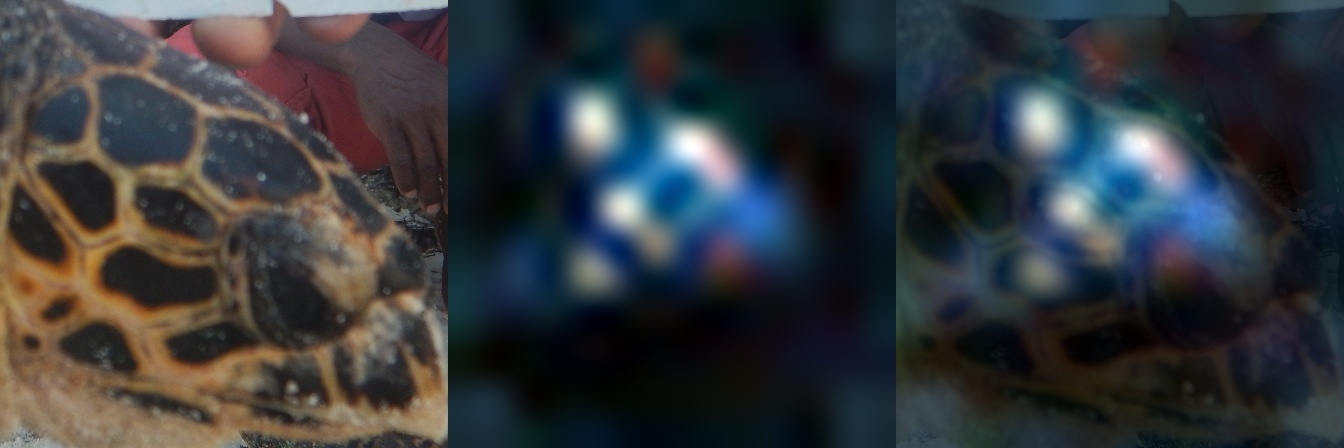
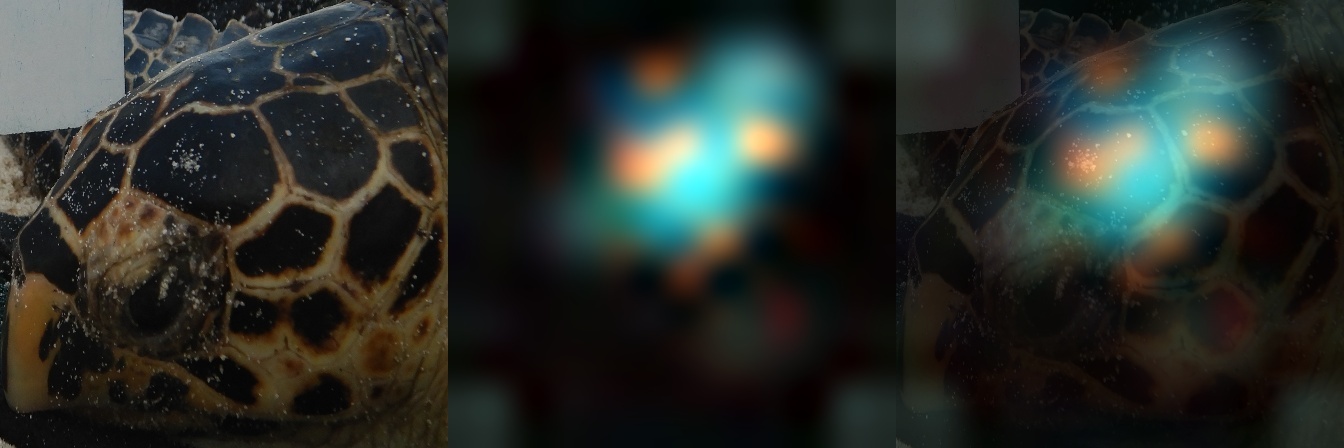
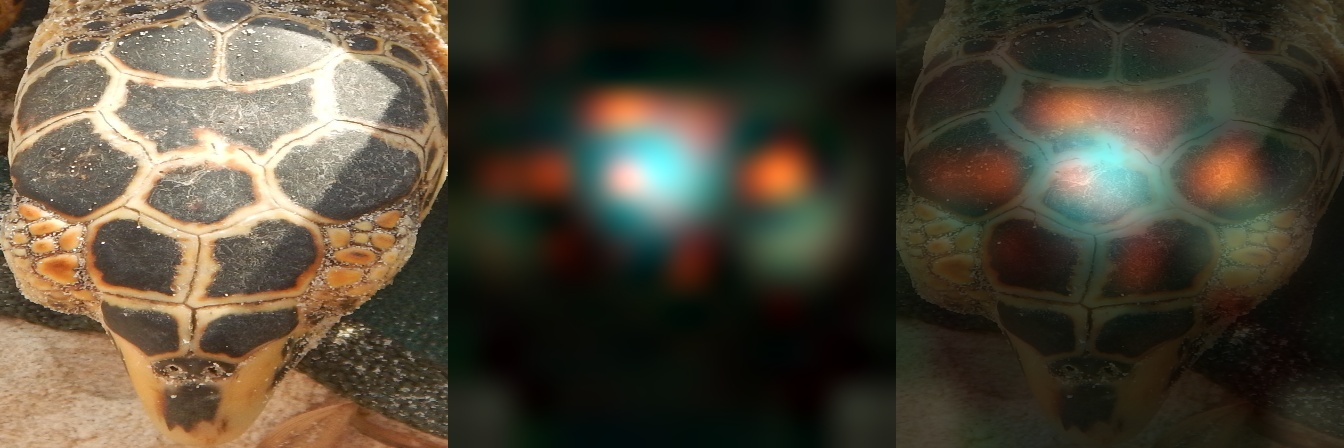
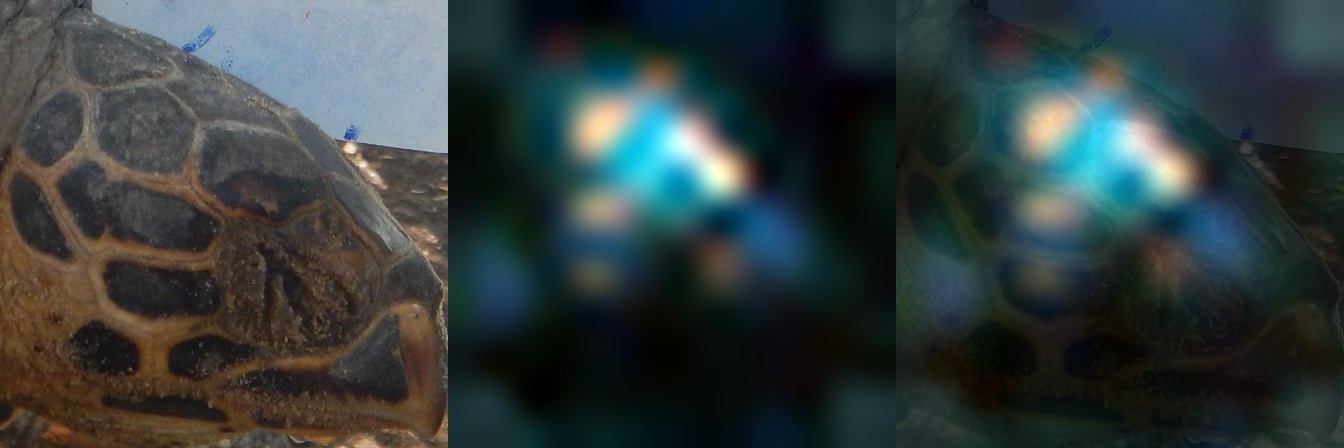
Visualisations of what NN look at
Data · 25 Apr 2022, 21:14 · 3
I made visualisation of places where most activuty happens during turtle analysis by neural net. It was made for 2 different nets. One is DenseNet121, other is EfficientNetB5. It was made for fun. I liked how it looks and decided to share. )
ZFTurbo,
This is awesome. Great stuff?
Would you show us the code, or a resource online where we could learn to replicate this?
Much as you said you made it for fun, did it help you create a better model?
Thanks a lot
Visualisation was based on my old Kaggle code:
https://www.kaggle.com/code/zfturbo/visualisation-of-siamese-net
Difference is that here I used GlobalAveragePooling for NN and not GlobalMaxPooling. It's harder to visualize in this case. )
I made visualisation after contest. So it didn't help.
This is good interpretable ML. Seems the body markers are the main feature for recognition. Thank you for sharing this with the community Roman @ZFTurbo.