Forecasting rainfall intensity from farmer-reported observations may sound simple—until you realize just how noisy, imbalanced, and region-dependent the data can be. For the Ghana’s Indigenous Intel Challenge, the mission was to classify rainfall into four categories—No Rain, Small Rain, Medium Rain, and Heavy Rain.Turning farmer-reported weather observations into reliable rainfall forecasts is a deceptively simple idea with the power to reshape agriculture. In the Zindi
My strategy was straightforward: design a model that could hold its own across districts, communities, and individual farmers, even when the test set threw in combinations the training data had never seen. After a series of experiments—and more detours than I care to recount—XGBoost ultimately emerged as the backbone of my approach.
Benson Wainaina won his first Zindi gold medal and first, first place on Zindi. With a Bachelor's degree from Penn State University in Computational Data Science, Beson’s journey most recently took him to OpenAI, where he excels as an AI Trainer.
Follow along in my GitHub repo.

🧭 Guided by EDA – Understanding the Landscape First
Before diving into XGBoost, I devoted a good chunk of time to exploratory data analysis—and it proved to be the backbone of the entire solution.
A few patterns quickly rose to the surface:
- A lopsided target: Nearly 88% of observations fell under “No Rain,” creating a major class imbalance that shaped every modeling decision.
- Location and farmer effects: Prediction accuracy wasn’t evenly distributed. Regions with more frequent rainfall naturally challenged farmers who tended to default to “No Rain.” Interestingly, most farmers showed strong accuracy only for that single category.
- Timing mattered: Mid-week predictions consistently performed better, likely because farmers had more environmental cues earlier in the week.

These insights shaped both my feature engineering and my encoding strategy. More importantly, they taught me that rainfall behavior was deeply tied to where and when the prediction was made.
🧹 Feature Engineering – Simpler Than Expected
In the early stages, I experimented with a range of sophisticated encoding techniques—target encoding, count encoding, and even a custom KNN-style encoding meant to capture how closely each farmer or community aligned with different rainfall patterns. On paper, the cross-validation scores looked great. On the leaderboard? Not so much. The public leaderboard wasted no time reminding me that these methods were overfitting spectacularly.
Once my ranking slid into the 50s, I revisited the starter notebook and spotted something I had previously overlooked: a date feature derived from prediction_time. My EDA had already shown that timing played a role, so I incorporated that feature along with the others I’d engineered.
Then came the turning point:
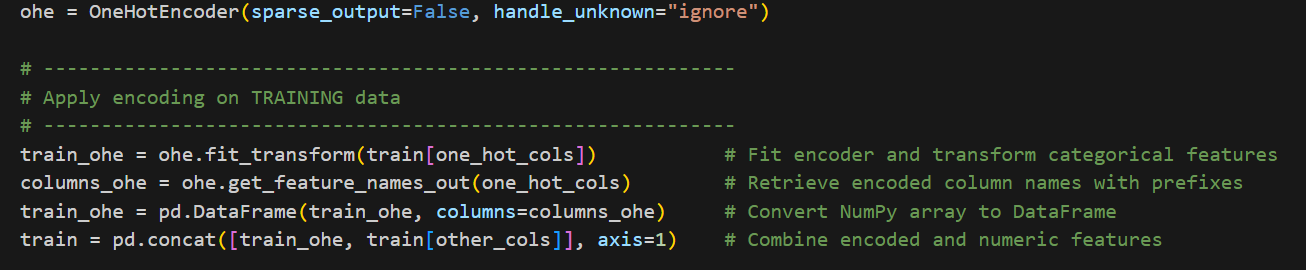
👉 I ditched the flashy encodings and reverted to simple one-hot encoding combined with custom label encoding for all categorical variables.
No magic, no heavy smoothing—just clean, transparent preprocessing that let the model do its job.
This turned out to be the turning point.
⚙️ Designing the Model – XGBoost Done Right
With the new feature set in place, I trained XGBoost models using:
- 20 stratified folds to ensure stability across all rainfall categories
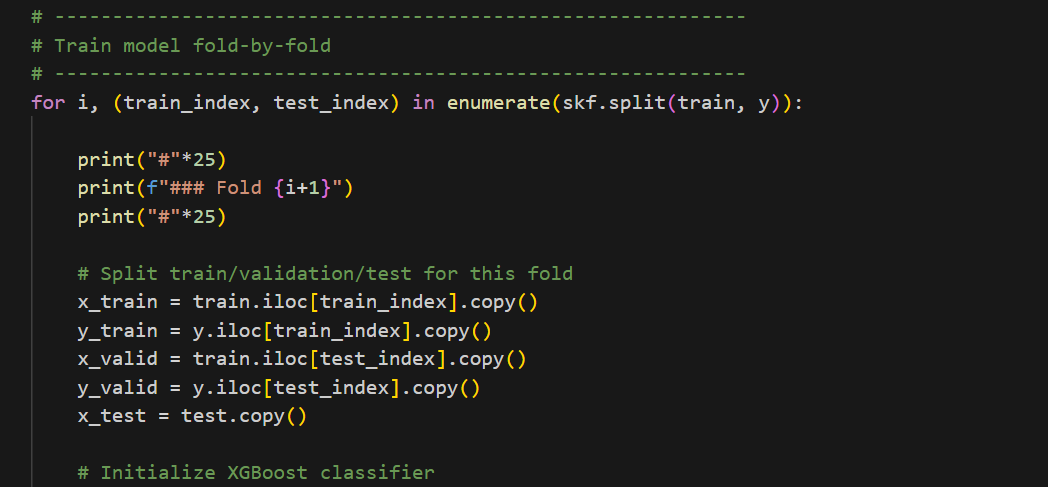
The goal wasn’t to squeeze out a perfect score on any one fold, but to build a model that behaved consistently and held up across every fold. Each split served as a miniature stress test: for every fold, I trained a fresh model on a different slice of the data to see whether its performance stayed stable rather than lucky.
This approach helped me focus on reliability, not winning the lottery with a single well-behaved fold.
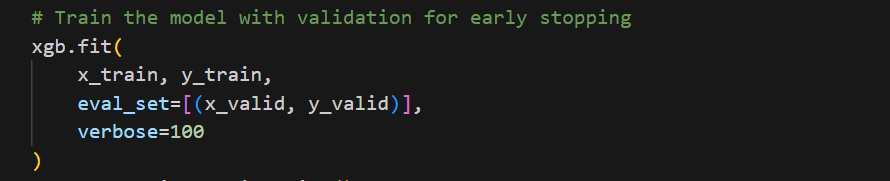
After training each fold-specific model, I generated predictions for both the validation split and the test set. The out-of-fold (OOF) predictions gave me a clear view of how well the model generalized across unseen data. For the test set, I combined predictions from all fold models and averaged them to produce the final, more stable forecast.

To my surprise, this “unexciting” setup outperformed every complex trick I had tested earlier. Even better, the cross-validation scores lined up almost perfectly with the public leaderboard—a rare and very welcome sight. That level of consistency was a strong signal that the model would hold its ground once the private leaderboard rolled around.
📈 Results – Stability Over Flashiness
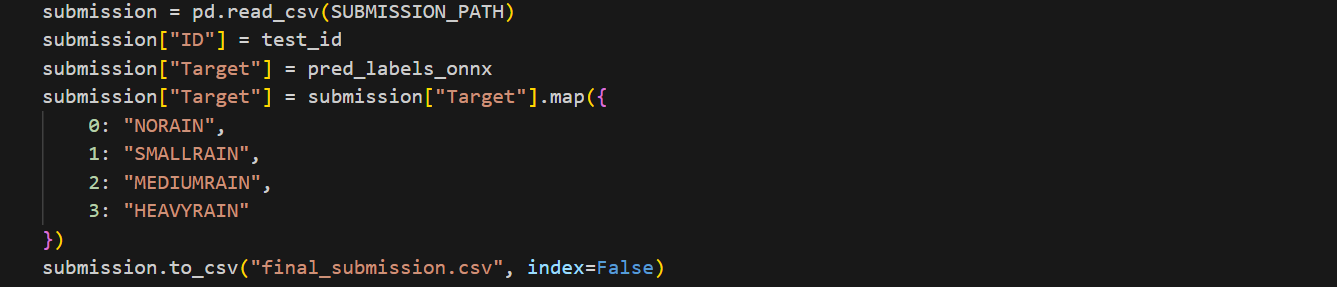
Once submitted, the XGBoost model immediately placed me around 15th on the public leaderboard. I tried several extensions—threshold tuning, ensembling with CatBoost and LightGBM, and more aggressive regularization—but none yielded improvements.
In the end, the simplest version of the model became the final submission.
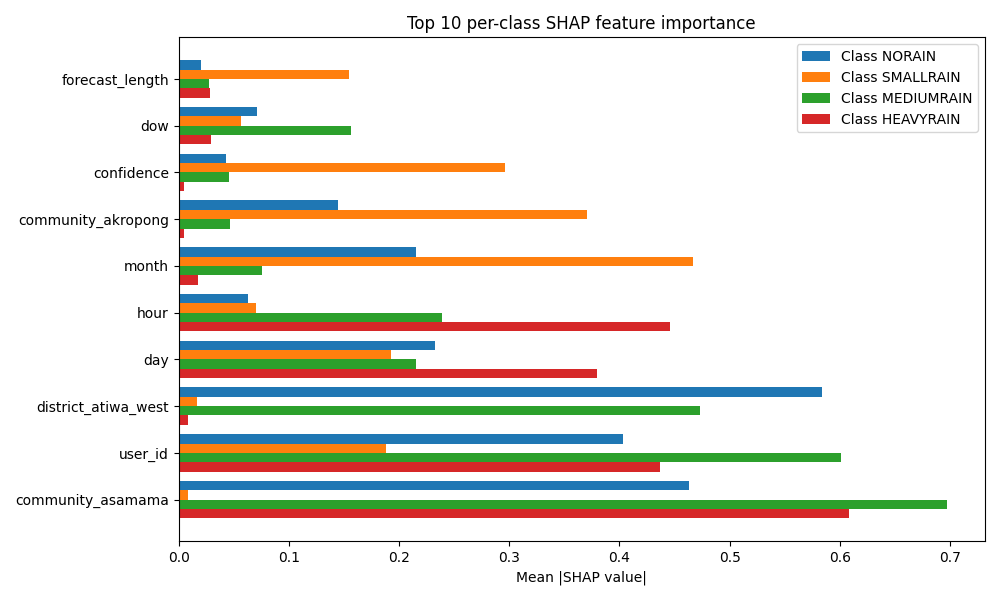
The plot below shows how the model works.
🔍 Why This Worked
The success of the XGBoost model boiled down to three key principles:
- Understand the data first
- EDA revealed imbalances, region-level patterns, and time-based behaviors that directly informed my features.
- Keep the encoding clean
- Fancy categorical encodings looked good on CV but performed poorly on unseen data.
- Favor stability over complexity
- Training across 20 stratified folds ensured that the model learned meaningful patterns rather than memorizing noise.
Final Thoughts
This challenge reinforced a valuable lesson: In real-world data problems, simplicity and data understanding often beat overcomplication.
By going back to basics—clean encoding, thoughtful features, and a well-validated XGBoost pipeline—I was able to build a model that generalized to completely unseen combinations of farmers, and communities.
 About Me

Benson Wainaina is a Penn State alumnus with a degree in Computational Data Science. His passion for the field was ignited by the realization that artificial intelligence can be a powerful force for addressing social challenges. While collaborating with teammates at Nyansapo, Benson helped develop a winning EdTech solution for the Nittany AI Challenge, aimed at tackling the high student-to-teacher ratio in Kenyan schools—an experience that deepened his commitment to leveraging AI for social good.
Driven by this purpose, Benson continues to create data-driven solutions that address real-world problems.