Floods are among the most destructive natural disasters, and as climate change intensifies, so does the need for timely and accurate flood detection systems. The Inundata: Mapping Floods in South Africa challenge on Zindi invited data scientists to create models capable of identifying the timing of urban flash floods using rainfall data. Team Central_Park reflections provide a valuable post-mortem of their approach, highlighting both the complexity of the task and the ingenuity it inspired.
Let me start off by saying that this was a super interesting challenge. Kudos to the Zindi team and the data providers for putting this together.
When I first started, I assumed the problem would be pretty simple — we just needed to predict the week a flood happened using CHIRPS precipitation data at each location. How hard could it be? In the beginning, I was even considering building a lightweight convolutional neural network model over the rain maps.
But it turns out, it's a hard problem! This is what makes it so interesting.
Our solution consists of four key stages:
1. Exploratory Data Analysis (EDA) & Data Preparation
We perform EDA on composite images to determine the optimal band combination for flood probability prediction. The best-performing band for this task was Moisture Stress.
2. Image Classification
Using Moisture Stress images, we train an image classifier (eva02_tiny_patch14_224) to predict the probability of flooding at each location. This feature significantly improves the overall model performance as a predictive feature on its own and later for the normalization stage
3. Modelling
We trained nine different models using a combination of flood probability, lagged precipitation values, rolling statistics, exponentially weighted moving averages (EWMA), and event time indicators. We used a 10 fold CV based on StratifiedGroupKFold for all the models and the cv scores for each are shown below
- XGBoost - 0.002344928
- LightGBM - 0.002392372
- FastAI Tabular - 0.002656410
- FastAI GatedConv - 0.002614245
- FastAI 1DConv - 0.002568254
- FastAI TabTransformer - 0.002845684
- TabNet - 0.002566037
- Wavenet-GRU - 0.002619232
- ResNet1D - 0.002407528
4. Ensembling
We ensemble model predictions using Nelder-Mead optimization and apply flood probability normalization to improve generalization and predictive performance. The normalization use the flood probability from stage 2 from the image classifier to perform normalization and this is a generalizable approach since the flood probability is a predictive feature.
- Mean Average Ensemble - 0.002088235
- Optimized Ensemble - 0.002072086
The above cv scores are without the normalization step btw! So you can see how ensembling a diverse range of models can lead to a really huge CV improvement!
Now the oof score after normalizing: - 0.00201654
Leaderboard Scores
- Optimized public LB / private LB (without normalizing): 0.002125168 / 0.002322155
- Optimized public LB / private LB (with normalizing): 0.002105851 / 0.002280238
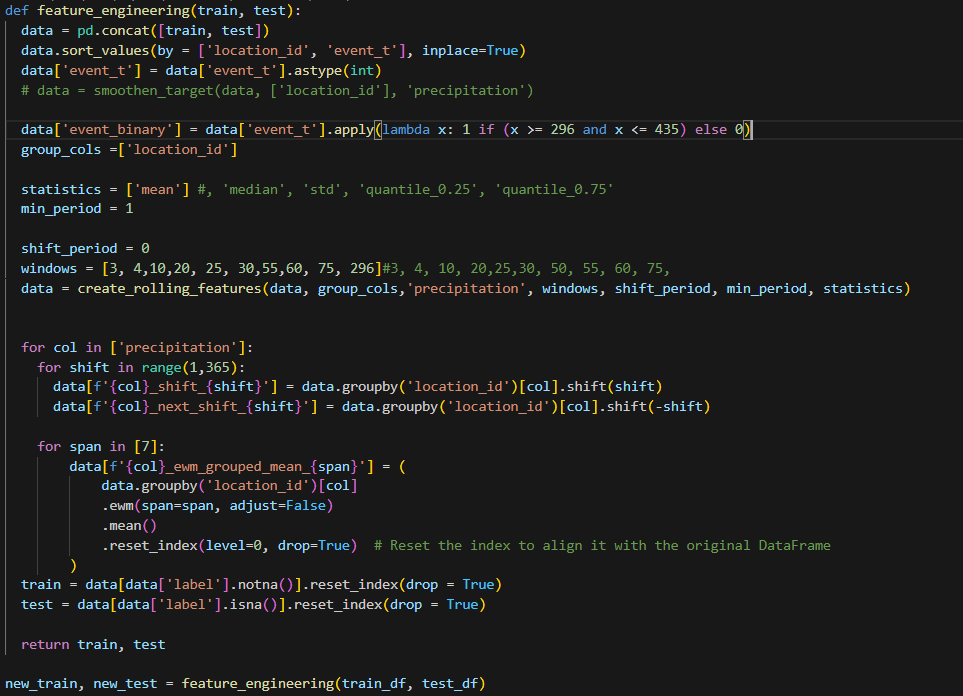
GBDT Modelling
Basically all the features I used on all the gbdt models(xgboost and lightgbm) are shown below plus now add the flood probability from stage 2 and the precipitation from the original data. I then tuned the features of each using optuna.
Conclusion
Our success in this challenge came from a combination of:
- Diverse modeling approaches (GBDT + deep learning)
- Extensive feature engineering
- Careful cross-validation strategy
- Ensembling and flood probability normalization
While GBDT models provided robust predictions, deep learning models captured additional complexity, and ensembling them together led to a significant improvement.
💻✨ Go give Team Central Park a star on their repo.