
AirQo Ugandan Air Quality Forecast Challenge

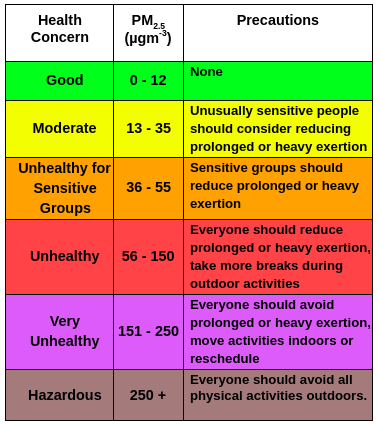
One of the main indicators of air quality is PM2.5 (particulate matter smaller than 2.5 micrometers in diameter or around 1/30th the thickness of a human hair). These particles can be generated by traffic exhaust, industry, burning of fossil fuels and many other sources. The particles are so small that they are invisible to the naked eye and when inhaled do not just collect in the lungs and cause respiratory disease but can also enter the bloodstream and contribute to heart disease and stroke. The critical measure is the mass of PM2.5 particles in a volume of air, given by micrograms per cubic meter (µ/m3).
Guidelines on hazardous levels of PM2.5 are given below
This data has been collected from five sensors stationed across Uganda. Readings are taken every hour. As is the reality with all data there are missing values. This is a challenge for you to overcome.
Your solution needs to be generalizable and be able to applied to all test periods without changing the solution parameters.
The objective of this challenge is to predict the air quality level at exactly 24 hours after a 5-day series of hourly weather data readings which include temperature, rainfall, wind, and humidity.
For example, you may be given weather indicators (but no air quality data) from 3:00 am on 9 March to 3:00 am on 14 March. Based on these weather indicators, you will need to predict the air quality reading at exactly 3:00 am on 15 March (24 hours after the last weather data reading). Note that you are not given the date or time for any of the data.
The weather indicators available in the train and test are:
- temp: mean temperature recorded at the site over the hour (degrees Celsius)*
- precip: total rainfall in mm recorded at the site over the hour (mm)*
- wind_dir: mean direction of the wind over the hour (degrees)*
- wind_spd: mean wind speed at the site over the hour (metres per second)*
- atmos_press: mean atmospheric pressure(atm)*
Each series of weather and air quality readings will be associated with a unique sensor. You will have a set of features on each of the five sensor:
- Location: one of either A,B,C, D or E referring to the five different locations selected
- loc_altitude: The height above sea level at the location in metres
- Km2: the area of the parish in which the device is located in square km
- Aspect: the direction the slope on which the device is located faces
- Dist_motorway: distance of the device from the nearest motorway in metres (values greater than 5000m are NaN)✝✝
- Dist_trunk: distance of the device from the nearest trunk road in metres (values greater than 5000m are NaN)✝✝
- Dist_primary: distance of the device from the nearest primary road in metres (values greater than 5000m are NaN)✝✝
- Dist_secondary: distance of the device from the nearest secondary road in metres (values greater than 5000m are NaN)✝✝
- Dist_tertiary: distance of the device from the nearest tertiary road in metres (values greater than 5000m are NaN)✝✝
- Dist_unclassified: distance of the device from the nearest unclassified road in metres (values greater than 5000m are NaN)✝✝
- Dist_residential: distance of the device from the nearest residential road in metres (values greater than 5000m are NaN)✝✝
- Popn: The population of the parish in which the device is located✝
- Hh: the number of households in the parish in which the device is located✝
- Hh_cook_charcoal: number of households in the parish in which the device is located which cook using charcoal✝
- Hh_cook_firewood: number of households in the parish in which the device is located which cook using firewood✝
- Hh_burn_waste: number of households in the parish in which the device is located which dispose of solid household waste by burning.✝
*Data courtesy of Tahmo network - https://tahmo.org/
✝Data courtesy of Ugandan Bureau of Statistics - https://www.ubos.org/
✝✝For definition of road classification see - https://wiki.openstreetmap.org/wiki/Key:highway#Roads
The target variable is pm2_5, i.e. mean mass of particulate matter smaller than 2.5 micrometres per cubic metre of air (µ/m3), as read exactly 24 hours after the last weather indicators’ reading.
The training data consists of 15,000 sets of 5 days of hourly weather data readings plus one air quality reading exactly 24 hours after the last weather reading. The test set consists of a different 5,000 sets of 5-day hourly weather data readings.
Files available for download are:
- Airqo_metadata.csv - This provides additional background information about the location and features of the parish in which each sensor is located.
- StarterNotebook.ipynb - this is a starter notebook.
- sample_sub.csv - is an example of what your submission file should look like. The order of the rows does not matter, but the names of the ID must be correct.
- Train.p - this is what you will use to train your model
- Test.p - this is what you will test your model on
- Train.csv - this is the same file as Train.p but in csv format. The sequences are a string object and the values are separated by “,”. You will need to convert the string sequence into a list sequence.
- Test.csv - this is the same file as Test.p but in csv format. The sequences are a string object and the values are separated by “,”. You will need to convert the string sequence into a list sequence.
Please note that the public leaderboard may not represent the full distribution of the year.
Notes for implementation
After the close of the challenge and the first meeting with Airqo the winner chosen for implementation will be given access to the full data set, including the reference files. They will also be given access to the undoctored forecast data for all 5 sensors including dates and locations.
AirQo collects data from 65 sensors around Uganda with recordings every 1.5 minutes. Data received from devices undergoes basic cleaning and is stored in BigQuery on Google Cloud Platform. Our website calls an API on an hourly basis and generates a forecast for each location for each of the coming 24 hours and caches it. Very little work is required to get the data into the desired form and a very basic model is currently implemented. The forecast is then updated live on our website and app so your solution will be available to all Ugandans, helping them plan and make decisions based on air quality.
Thought will need to be given to process speed, resources needed and sustainability.