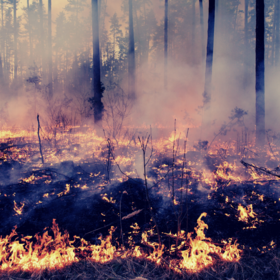
CMU-Africa: Fighting Fire with Data by CMU-Africa Data Science Club
Helping Rwanda
Knowledge
Completed (over 5 years ago)
Prediction
30 joined
19 active
Start
Oct 31, 20
Close
Oct 31, 20
Reveal
Oct 31, 20
About
We’ve split up Zimbabwe into 533 equal areas, centered around the locations provided in the lat/lon columns. The target variable, burn_area, is the percentage of the area that has been burned in a given month. Due to the way it’s measured, there may be some overlap of burned areas for two successive months, and so the total burned area over a time period isn’t necessarily equal to the sum of the ‘burn_area’ figures for all months. You are not permitted to use external data in this competition.
Data for download
- Train.csv - is the dataset that you will use to train your model. This provides the details for 3821 area squares across the DRC for each month of the year starting from 1 April 2000 to 1 December 2013.
- Test.csv - is the dataset on which you will apply your model to. This dataset contains the same variables as the test data except there is no target (‘burn_area’). This is what you are predicting. The test sets covers 3821 area squares across the DRC for each month of the year starting from 1 January 2014 to 31 December 2016.
- SampleSubmission.csv - is an example of what your submission file should look like. The order of the rows does not matter, but the names of the IDs must be correct. The IDs take the form of [area ID]_yyyy-mm-dd. There are 3821 area squares each with a unique ID ranging from 0 to 3820.
- VariableDescription.csv - Descriptions of the variables in the train and test set. You can find the sources of the variables in the below links.
- StarterNotebook.ipynb - this starter notebook will help you make your first submission onto the leaderboard.
The additional data included in the test and train files is as follows:
- Climate: All columns climate_[variable] derived from https://developers.google.com/earth-engine/datasets/catalog/IDAHO_EPSCOR_TERRACLIMATE - see the image bands listed for more information.
- Land Cover: The percentage of the area falling into each of the LC_Type4 land cover types https://developers.google.com/earth-engine/datasets/catalog/MODIS_006_MCD12Q1 - see for details.
- UN-Adjusted Population Density (estimated number of persons per square kilometer) from https://developers.google.com/earth-engine/datasets/catalog/CIESIN_GPWv411_GPW_UNWPP-Adjusted_Population_Density
- Mean elevation in meters, from https://developers.google.com/earth-engine/datasets/catalog/USGS_GMTED2010
- Monthly Precipitation Estimates - https://developers.google.com/earth-engine/datasets/catalog/TRMM_3B43V7
Join the largest network for
data scientists and AI builders
Status
© Zindi 2026