Côte d’Ivoire Byte-Sized Agriculture Challenge

Helping Côte d'Ivoire
7 000 EUR
Completed (~1 year ago)
Classification
Object Detection
896 joined
163 active
Start
Apr 25, 25
Close
Jun 16, 25
Reveal
Jun 16, 25

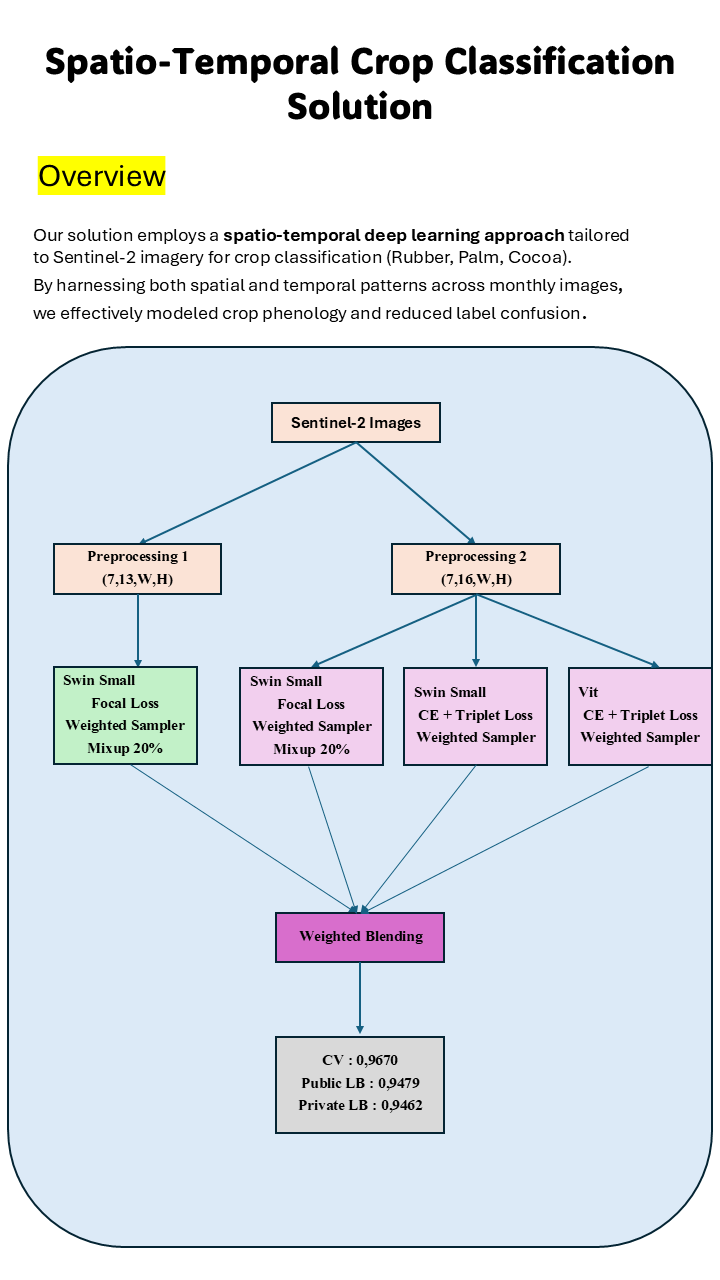
🥉 3rd Place Solution
Notebooks · 18 Jun 2025, 11:40 · 13
Hello everyone,
It’s been a while since I last posted on Zindi, and I’m happy to share our solution for this competition!
Feel free to ask any questions in the comments section.
Note: I am a Tunisian resident. Using the Palestinian flag is my way of standing up against the genocide and the starvation that people are facing there.
------------------------------------------------------------------
I am quite new to using sentinel data from scratch, and I find this a bit confusing. It would be great to see how you prepared your the data for modeling. I think I had trouble doing that especially for gbdt instances.
By the way, good work and congratulations to the team @ASSAZZIN.
Sure, Here is it.
def __getitem__(self, idx): group = self.id_groups.iloc[idx] tif_paths = group['tifPath'] # List of tif paths for this ID target = group['Target'] images = [] for tif_path in tif_paths: image = process_window(tif_path) # Out : (12, H, W) # Normalized RGB rgb_indices = [3, 2, 1, 8, 10, 11] bands = [] for i, idx_band in enumerate(rgb_indices): band = image[idx_band] bands.append( normalize_band( band, method=self.normalization_method, band_index=idx_band+1, sentinel2_stats=self.sentinel2_stats, scale_max=self.scale_max, ) ) img = np.stack(bands, axis=0) # (6, H, W) # Compute and concatenate vegetation indices indices = compute_indices(image) # (10, H, W) img = np.concatenate([img, indices], axis=0) # (16, H, W) if isinstance(img, np.ma.MaskedArray): img = img.filled(0) img = np.moveaxis(img, 0, -1) # (H, W, 16) # keep for albumentations img = img.astype(np.float32) if self.transform: img = self.transform(image=img)["image"] img = torch.tensor(img, dtype=torch.float32) images.append(img) # keep only the first 7 months images = images[:7] images = torch.stack(images, dim=0) # (N_imgs, C, H, W) if self.to_train: target = rev_mapper[target] return images, target else: return imagesWe even implemented an improved version where we took all 12 months in the correct order. Missing months were created as empty arrays with the shape (H, W) of the current observations (the January month is always present).
The model's performance was 94 CV (worse than using the first 7 months), Public LB was 92, but surprisingly Private LB was 95.8
Thank you @ASSAZZIN. I truly appreciate it.
And congratulations once again.
Congrats and keep up the good work., i would like to ask how did you develop this situation and why this specific approach ?
👏 🎉 Congratulations. well deserved nic work. Is it possible to get access to the code
Kudos @Assazzin. Mine was quite different and surprisingly a very simple model got the best score on the private leaderboard.
My approach:
I extracted summary statistics of band indices and included the raw spectral bands. I included harmonic regression terms and for each ID and included the computed the amplitude and phase of these harmonic terms. I was able to get F1 score above 92 from three gbdt models. I had lots of features from this and did some basic features selection method to select a fraction of relevant features. I also added latent features from PLS regression to my gbdt into my model.
Surprisingly, using PLS regression and linear discriminant analysis models, only had very stable CV locally and private LB above 94, unfortunately I didn't choose them because they had lower public LB score compared to the gbdt models. In fact, linear discriminant analysis model got a private LB of 97.1 😢.
Please can you elaborate more on the harmonic regression terms @Gozie.
Hi @codejoe,
It's a type of linear regression where you model a pattern that repeats over time (cycle). So you basically incorporate the sin and cos of a time component ((2 * pi * t)/ period) to model a seasonal pattern of dependent variable.
So, for an hourly seasonal pattern, the period becomes 24. I noticed that there was a monthly seasonal pattern. With the sin and cosine coefficients you could calculate the amplitude and phase which are the range the dependent variable oscilates around the mean (intercept) and the peak and trough time (from phase) respectively. It was these amplitude and phases for each ID that I added to my model as features. Surprisingly, these features were amongst the top features. It seems the crop types have distinct seasonal patterns where they peak and decline.
Frankly, some of the features I came up with were suggested by the LLM's I used and I had to validate their suggestions before deciding whether I use them or not.
Oh alright. So basically taking the output of a linear regression which incorporates the sin and cos time component?
Yea, something like that
Thanks for sharing @Gozie and congratulations moving that far. 🔥 It will also be nice if you could share code implementing the harmonic linear terms 🥲