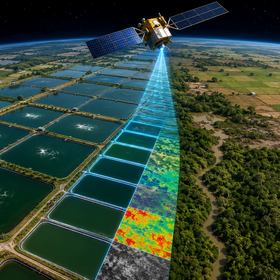
GeoAI Aquaculture Pond Identification Challenge by FAO and ITU
You are provided with a tabular dataset consisting of 1,821 entries for training and 1,030 entries for testing. The tabular features are derived from Sentinel-1 and Sentinel-2 satellite imagery across two pilot regions.
Features are organised as 12 monthly composites per location. The features include:
- Sentinel-1 (SAR) - radar backscatter bands (VH, VV), capturing surface texture and moisture. Radar is cloud-independent and is present for all valid months.
- Sentinel-2 (Optical) - multispectral surface reflectance bands (blue, green, red, red-edge 1/2/3, NIR, narrow NIR, SWIR 1/2), capturing the spectral signature of water bodies and surrounding vegetation. Optical data may be absent for a given month due to cloud cover, even when S1 data is available for that month.
Missing data: Months with no valid observations are filled with -9999 for all bands. Each test sample contains 4, 5, or 6 consecutive months of data with the remaining months masked. This design is intentional - models must learn to identify ponds from whatever seasonal window is available, rather than relying on a fixed time of year.
In some cases, S1 radar data is present for a month where S2 optical data is absent (due to cloud cover). This is a real-world characteristic of multi-sensor satellite datasets and should be handled by your model.
Note on class distribution: The training set contains approximately 40% positive (pond) examples. The test set may have a higher proportion of positives. We recommend participants account for this when tuning classification thresholds.
Latitude and longitude are not provided. Only the data supplied for this challenge may be used.
The target variable is binary: aquaculture pond (1) or other (0).
Join the largest network for
data scientists and AI builders