
GeoAI Challenge for Air Pollution Susceptibility Mapping by ITU

The European Air Quality Index (AQI) is based on concentration values for up to five key pollutants, including PM10, PM2.5, O3, NO2, SO2. There are some considerations regarding the station type (e.g., traffic station) and how to aggregate the pollutants to compute the AQI. These guidelines are provided by the European Environment Agency and must be used to prepare the data and produce the final output.
The challenge is to implement a machine learning method which can accurately estimate the pollution levels (AQI) of the city of Milan during 2022. The AQI timeseries follow a seasonal trend, therefore the expected output are the seasonal (spring, summer, autumn, and winter) AQI susceptibility maps during 2022 considering the factors (e.g., meteorological) that may condition the pollution levels.
For practical reasons, four (4) seasons were defined as:
-Season 1: January-March
-Season 2: April-June
-Season 3: July-September
-Season 4: October-December
The discrete timeseries data of the pollution levels are provided from 2016 to 2021 in the metropolitan city of Milan, where the city of Milan is located. Additional data of factors that may influence the pollution levels are provided. The data has been preprocessed and the points are provided in a tabular format containing all the relevant data. The data includes meteorological timeseries, land cover maps, the digital terrain model, a geological map, the river distance, and other relevant data. The meteorological timeseries consists of discrete points.
The data available is
- Meteorological timeseries data (2016-2022) which includes temperature, precipitation, relative humidity, solar radiation, wind speed and direction at a daily temporal resolution.
- Air pollution timeseries data (2016-2021) which includes NOx, SO2, CO, O3, PM2.5, PM10, and benzene at a daily temporal resolution.
- Digital terrain model, land cover, geology, plan curvature, hill shade, slope, SPI, TRI, TWI are provided at the stations’ points and as a continuous representation at 100-m resolution.
*Note: It is not mandatory to use all the sources of data. Participants are free to use open satellite and/or model-derived data (e.g., ERA5 or aerosol data) up to 2021. Other sources must be specified, and their utilisation should be detailed in the final document.
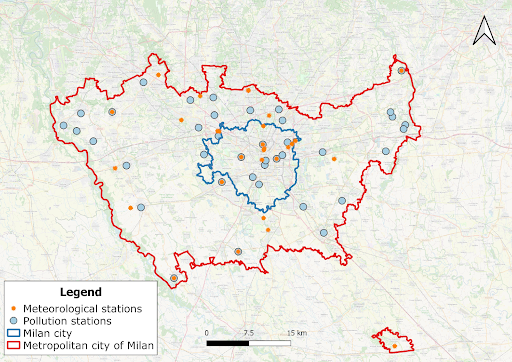
Figure 1. Location of the meteorological and air quality stations in the metropolitan city of Milan.