
IBM SkillsBuild Hydropower Climate Optimisation Challenge

So several discussion posts talked about the oddly strange diffrerences in validation/test/leaderboard metrics. I've tried to upload three plots here but couldn't, so I'll try to write down the main results.
Mycro-hydropower plants are water-based mechanisms of energy generation. This means that if in the previous times (months?weeks?days? Still trying to figure it out) it didn't rain, or the meteorological conditions were such that there isn't enough water to power the plants, they won't generate energy.
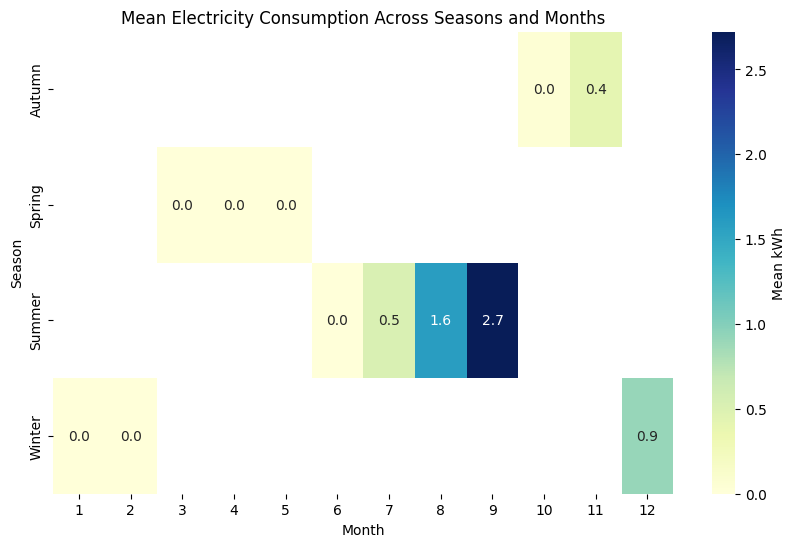
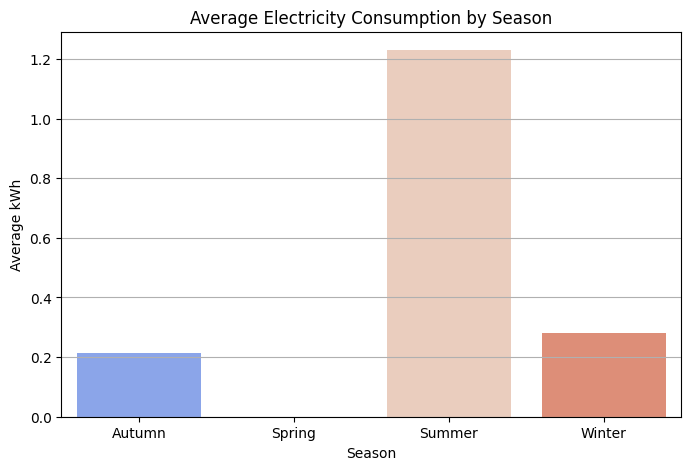
So, for example, the lack of any measurements of kwh after the Winter (in the Spring season, try to plot the seasons against the mean of kwh for example) isn't because there were errors in measurement. It exists because it's impossible to generate energy with MHP in Spring.
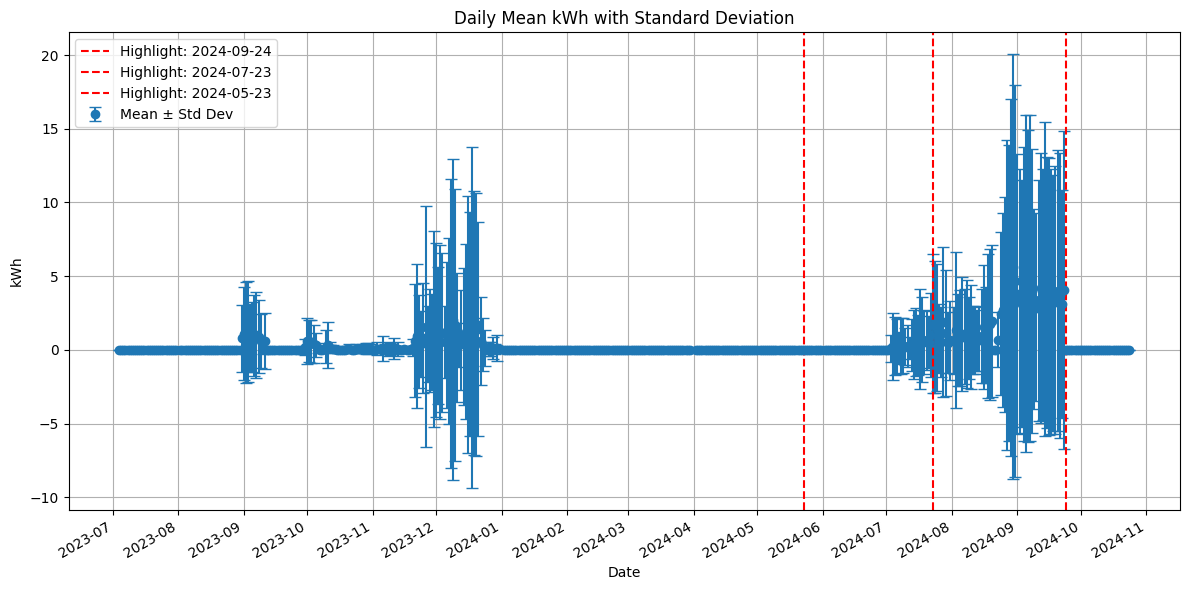
This explains why (if you plot the mean and std of kwh against time) we have some measurements from September 2023 until December 2023 but NO MEASUREMENTS AT ALL from January 2024 until June 2024. This means that if you do a time-base split for your validation schema, your model will necessarily appear as overfitting, since in the several months in which there are no measurements your model will perform well. Furthermore, the last few months (from July 2024 on) have several positive values of kwh.
I'm still trying to understand how to create a validation schema in which my test set reflects the leaderboard. I'm accepting suggestions. But I think the key in this competition is identifying meaningful relationships with time stability and also a meaningful validation schema.
Very Insightful! No wonder when I dropped those values I got a drastic difference in the score with gbdt.
Interesting insights, thank you. I guess beyond feature engineering, figuring out a robust cv is perhaps key to solving this problem
hey @silvaemqap to post the plots just drag and drop the plots to the discussion tab. Click edit your post then drag and drop
thx a lot. The plots were added now :)