
IBM SkillsBuild Hydropower Climate Optimisation Challenge

Hey everyone, this has been a challenging competition and I've really struggled to break the baseline.
Through my analysis I found something that may sound obvious, but I noticed wayyy too late is that there are clearly dominant signals from consumers and devices, take for example 'consumer_device_18_data_user_12' - this user device combo has peaks above 70 kwh - most other devices have a mean/power around 1 kwh or below.
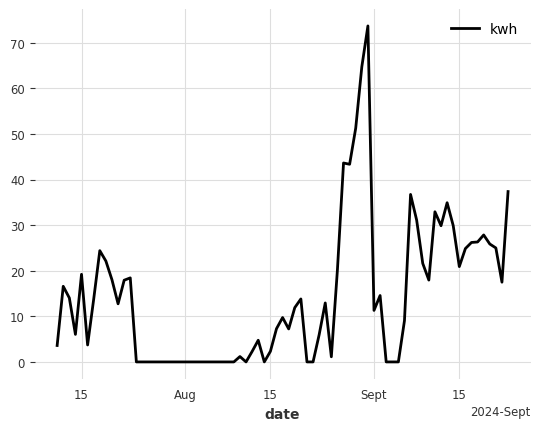
So, to forecast effectively we can't treat these as outliers as signals like this are the main contributors to demand... If anything the majority of other devices basically produce nothing.
Now, given that we have devices that are mega producers, the small producers probably throw your models off, because they basically produce nothing and have low correlations with weather data... The other item that I notice is downtime in the mega producers, look at the August period, all of a sudden the device produces nothing - thus throwing off your usual correlations with weather data and even auto-correlation.
My thinking is that:
1. I need to find out what the heck causes the spike in September - my intuition is that there was a lot of rainfall, and perhaps other devices with common users are down meaning that demand spiked for this device.
2. Need to figure out a way to model downtimes or predict downtimes for a device so that this can be factored into the forecast.
If anyone is willing to share feedback on these ideas, I'd be grateful🙏... Nontheless, I hope my rambling makes sense 😅
If this is true, it should apply to all users, since they share the same climate data.