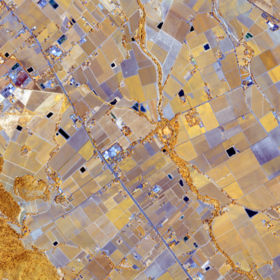
ICLR Workshop Challenge #2: Radiant Earth Computer Vision for Crop Detection from Satellite Imagery
Thought I'd share my approach since it seems to be holding up.
Feature Engineering is essentially unexplored - all I've added for the raw pixel values is NDVI (`(nir-red)/(nir+red)`) at each date, plus the month with peak NDVI.
I'm grouping the values by field, taking the mean of most pixel values and tracking the earliest and latest NDVI peaks. So again, almost no feature engineering.
The real trick: there are ~1000 fields with 20+ pixels. Rather than getting a single row in my training set for each of these, I create several 'subfields' from each large field by sampling only a fraction of the pixels that make up that field. With this approach you can double or triple the number of rows in your training set - just keep an eye on the class balance. This is nice - it means you throw away less useful info than you would if you just took the mean band values for a whole field.
After that, I fit a catboost classifier as in the starter notebook and also tried a tabular neural network with fastai (actually fastai2). Both did OK, taking the mean of the predictions put me in 2nd place.
I'm interested to head what others are doing - I think this field subsampling approach + some decent FE should make a killer combo, so please give it a go :)
Good luck!
Any starter notebook about the tabular fast ai ?
I won't be sharing code for this one - it's very hacky, and also I think Zindi/hosts own the IP on the top 3 entries. But I'm not doing anything fancy, and only used fastai2 out of interest. Your best bet to replicate is to follow the tabular docs (https://docs.fast.ai/tabular.html). If you do want to try v2 there's this: https://github.com/muellerzr/Practical-Deep-Learning-for-Coders-2.0/blob/master/Tabular%20Notebooks%20(old)/03a_Tabular.ipynb (might need an update since things are all still experimental). The author of that (Zach) has also been doing some fun benchmarking stuff at https://github.com/muellerzr/fastai2-Tabular-Baselines/tree/master.
you must have up to like 500 features then.
basically am still with your starter notebook and it's cat boost that is still given me the best score.
am trying to use lightgbm to have a good score and also Average of the score will be a major boost.
can you please send a quick guide to create NDVI
NDVI is calculated from two of the image bands - B04 (red) and B08 (near IR). For each date, take the values for those two bands and follow the formula. In code, for each date string (datestr):
nir = df[datestr+'_B08']
red = df[datestr+'_B04']
ndvi = (nir-red)/(nir+red)
df[datestr+'_NDVI'] = ndvi
thanks
Thanks
@john i'm grouping the values by field, taking mean of the most pixel values and tracking the earliest and lastest NDVI peaks.
Taking Aggregate values per field ID is as potent as using the field ID itself. Are you saying we can use the field ID to generate features???
Kindly clarify
I think field is unique
If the model was using Field ID as a feature or using it to derive other features that maintain the order (and thus leak info on the crop type) that would be in violation. But the goal of the challenge is to predict crop type per field - looking at field-level stats is fine afaik.
"Taking Aggregate values per field ID is as potent as using the field ID itself. Are you saying we can use the field ID to generate features???"
My reading is that you can't use the actual ID of fields, since there may be a relationship between, say field ID 3000 in train, and ID 3001 in test, since they are possibly nearby. But you can use the knowledge that field ID 3000 is comprised of pixels (200,200) through (204,204) for instance. My assumption. Clarity would be good.
I already waiting for this clarification
Can we use the dates to generate new features, like the duration between the highest ndvi and the lowest ndvi
No, the rules explain "Models that use metadata such as dates or spatial coordinates will not be accepted as a winning solution. You may use the dates to reconstruct the 2x2 grid (00 01 02 03) into a single mosaic." I assume you are allowed to use knowledge that the images are from different dates, just not use the date itself or delta between dates in any way.
What could possibly go wrong? :)
Thanks, I hadn't seen that.
Thank you, very interetsing ideas. I have a question, can we use the mean of two models? I thought i saw in the rules that we cannot ensemble models (cannot find it anymore, so maybe it was removed or this was for a differnt competition)
"tracking the earliest and latest NDVI peaks" - I thought no date usage was allowed?
maybe you missed but here
https://zindi.africa/competitions/iclr-workshop-challenge-2-radiant-earth-computer-vision-for-crop-recognition/discussions/744
was said that we cant use Field ID as feature
Danil