
Togo Fiber Optics Uptake Prediction Challenge
'%3e%3cg id='b'%3e%3cpath id='a' d='M0-95V0h50' transform='rotate(18 0 -95)'/%3e%3cuse xlink:href='%23a' transform='scale(-1 1)'/%3e%3c/g%3e%3cuse xlink:href='%23b' transform='rotate(72)'/%3e%3cuse xlink:href='%23b' transform='rotate(144)'/%3e%3cuse xlink:href='%23b' transform='rotate(216)'/%3e%3cuse xlink:href='%23b' transform='rotate(288)'/%3e%3c/g%3e%3c/svg%3e)
The Fiber To The Home (FTTH) customer data was collected from Togocom and GVA operators and General Population and Housing Census (RGPH) data comes from National Institute of Statistics and Economic and Demographic Studies of Togo (INSEED).
The dataset collected comes from agents providing telecommunications services, including the sale of credit, SIM cards, and internet (data) connections,. The basic administrative unit taken into account in this study is the municipality.
We also include earth observation data from Berkeley’s MOSAIKS API.
There are 30,558 observations in the training dataset and 13,097 in the test dataset. Both datasets have 4002 variables to use as inputs for prediction.
MOSAIKS (short for “Multi-Task Observation Using Satellites and Kitchen Sinks'') transforms satellite imagery from almost anywhere on earth into summary information that can be used to predict a wide range of different outcomes (''tasks”) in a matter of minutes using a standard laptop computer. This means users can leverage imagery information to solve a variety of customized measurement challenges using basic statistics and a laptop, without ever needing to store or directly manipulate raw imagery, which requires significant computational resources. Contestants will use MOSAIKS features as the inputs of the predictive models they develop. Contestants will show their mastery of data science approaches and predictive modeling through how they select which features to use for their models, assess and select models, and calculate and communicate uncertainty of predictions.
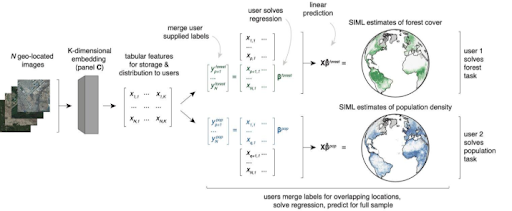
Figure 1: Architecture of MOSAIKS
The structure of this file consists of several columns that provide essential information for prediction. The first two columns are dedicated to the geographical coordinates and contain the longitude and latitude of each point of interest, respectively.
A third column named "BoxLabel" is also present in the data. This column contains the value "Box0" and is used to identify specific groups of geographic points.
The other 4000 columns, numbered from 0 to 3999, contain float values that represent MOSAIKS-specific characteristics. These features summarize information indicating color, texture, and spatial structure, providing accurate and detailed information sourced from satellite imagery for each geographic point.
View the Train set here - https://drive.google.com/drive/folders/1CFQgzpJmjUv12PB8sJc79NRp-y-3r40T?usp=sharing