For many people joining Zindi, this will be the first time they enter a machine learning competition. This can be a scary challenge, so we're trying make it easier with a step-by-step guide to making your first submission on Zindi. Follow along with us, and you'll be racing up the leaderboards in no time.
Zindi provides different categories of competition:
- Prize competition: you win prize money if you are among the top 3 winners of a particular competition.
- You win points: Points increase your ranking among other data scientists on the platform.
- You gain knowledge: Knowledge competitions are where you can learn and increase your skill set.
As a data scientist or ML engineer in Africa, Zindi Africa is the best platform for you to learn and take your skills to the next level. The following are some of the benefits you can gain by being part of the Zindian family:
- Test your skills against top talent across Africa and beyond
- Learn by doing and gain practical exposure to real data science problems
- Earn income by doing what you enjoy
- Build your profile and attract potential employers
- Learn from others through collaboration and discussion with other data scientists and ML engineers.
In this article, we provide a walkthrough of how to enter a Zindi competition for the first time. In this article we will:
- Join a specific competition called Financial Inclusion in Africa
- Understand the competition description and problem statement
- Download and analyze the dataset provided
- Process the dataset provided
- Develop a model to predict who is most likely to have a bank account
- Evaluate the model performance
- Use the model to make predictions for the test dataset provided in the competition
- Make the first submission and get placed on the Zindi leaderboard
Financial Inclusions in Africa
Before we go deep into the competition, let’s understand the competition page first by clicking here. If you don’t already have a Zindi account you can create one for free here.

The competition page provides some information to help you understand the problem you are going to solve, by reading the problem statement, how you can participate and how to submit your solution on the platform.
We will go through each tab and explain its functionality.
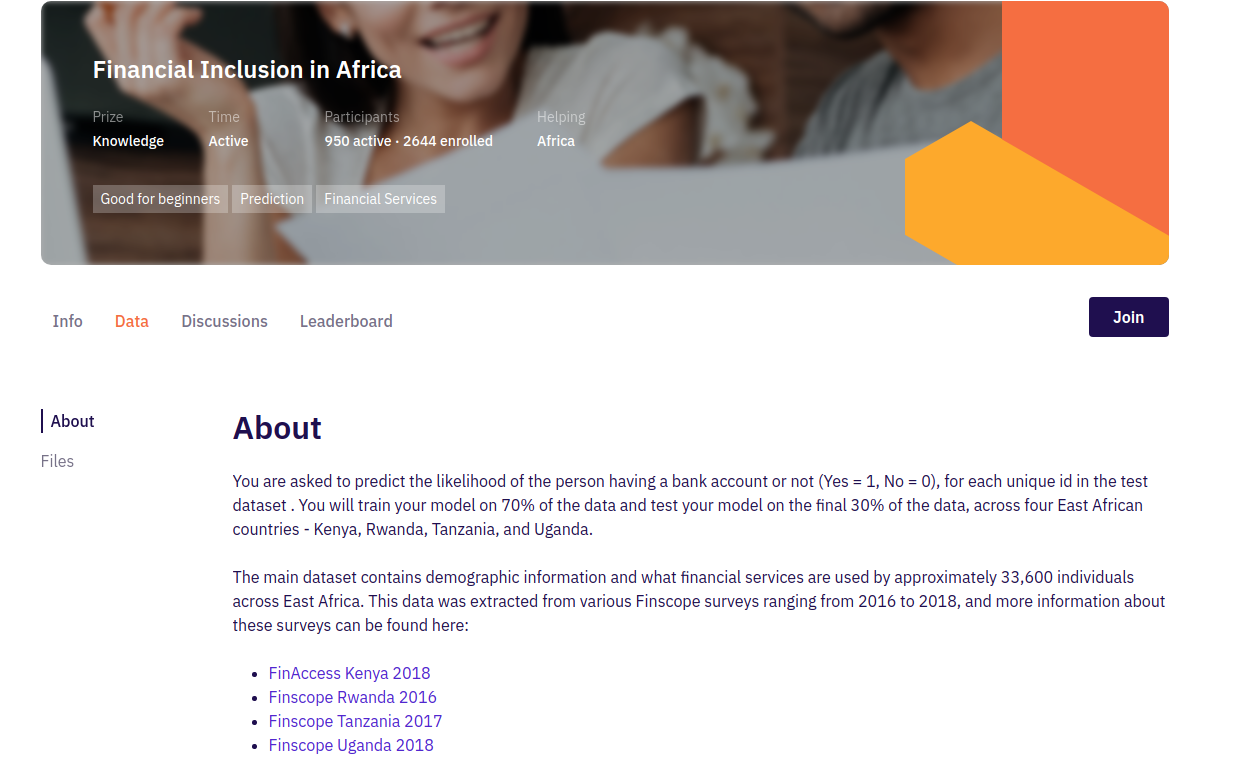
1. Info
The info tab contains the problem statements of the competition and list of organizations that have either provided the dataset or funded the competition.
On the left side, you can see a list of vertical tabs that provide more information about the competition.
(a) Description
It provides the problem statement of the competition and a list of organisations or companies that supported the competition, either by providing the datasets or funding the competition.
We suggest you read the description of this competition in order to understand the problem and machine learning approach you can choose to solve it. If you read the description, you will understand that the objective of this competition is to create a machine learning model to predict which individuals are most likely to have or use a bank account.
(b) Rules
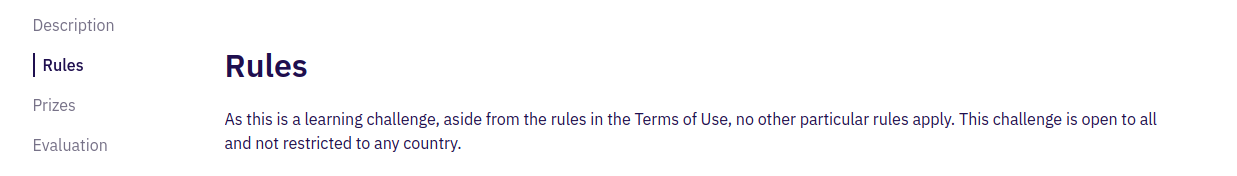
Each competition has its own rules. Breaking the rules can lead to disqualification, so make sure to carefully read and understand all the rules of the competition.
(c) Prizes
Now, this is the best part: the prize section provides details about the prize money that will be provided for the first, second and third place winners of the competition. But remember not all competition provides prize money for its winners; in other competitions, you can get Zindi points or gain knowledge.
(d) Evaluation
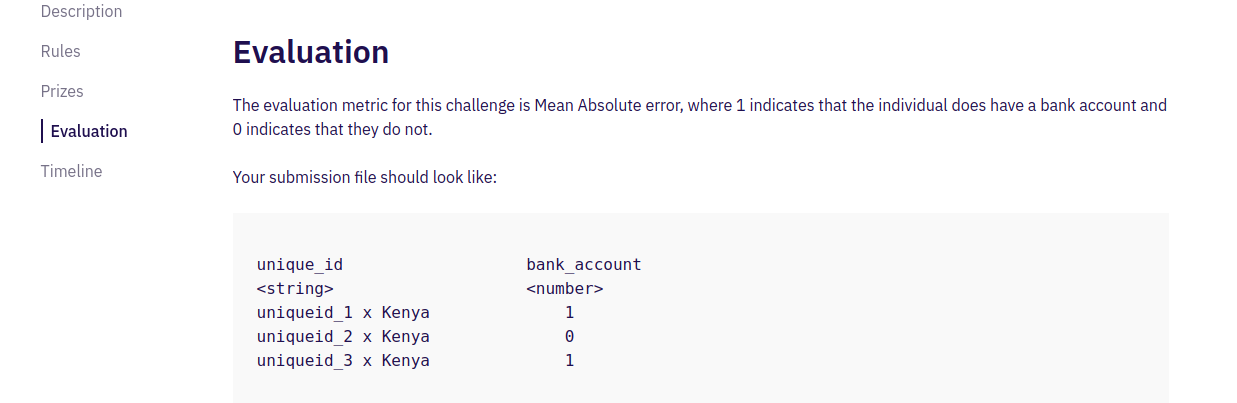
Each competition has its own evaluation metric that will be used to evaluate your results and rank you on the leaderboard. It also shows how you should prepare your submission file before uploading your file on the platform.
For this competition, the evaluation metric will be the percentage of survey respondents for whom you predict the binary ‘bank account’ classification incorrectly.
(e) Timeline

This section provides information about the start date of the competition and the end date and time of the competition. If you submit your solution after the deadline you will receive a score but it will not reflect on the leaderboard. Make sure to submit before the deadline if you want to be considered for a prize.
This competition has been reopened as a knowledge challenge, this means it will not close.
2. Data
The data tab contains a description of the dataset you are going to use for this competition. On the right side of the page, you can see a list of links to download the dataset and other important files. You will download:
- VariableDefinition.csv — This file contains a definition of each variable in the train and test data.
- SubmissionFile.csv — The file contains a sample of how the submission file should look like.
- Test.csv — This is a test data file you will use for prediction and save your results in the submission file.
- Train.csv - This is a train data file that contains both the independent variable and the target one. You will use this dataset to train your model.
These files may differ between competitions. Also, keep in mind that you must join the competition in order to have access to the data files.
3. Discussion
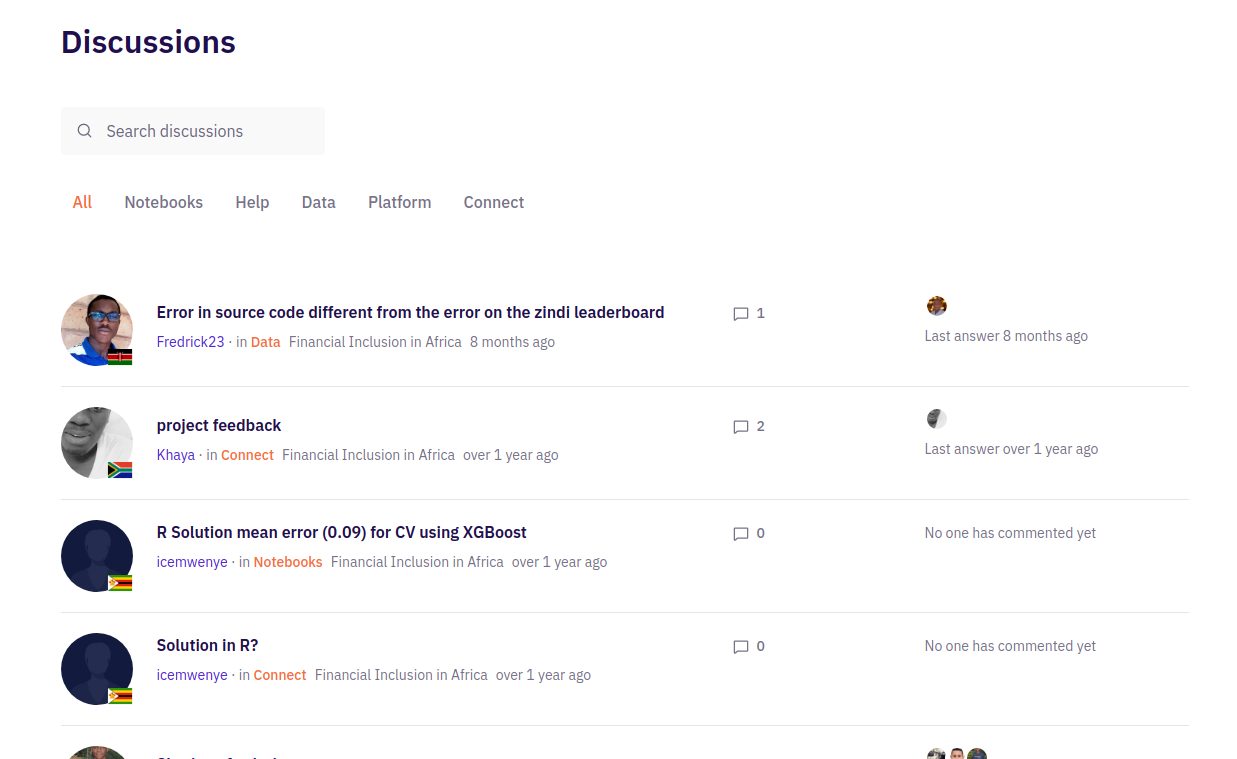
We're not Liverpool FC fans but we like their slogan: “You will never walk alone”. That is the purpose of the discussion page, you don’t need to walk alone throughout the competition. If you face any challenge or uncertainty during the competition or you want to ask a question to understand more about the dataset provided, you can post on the discussion page and other data scientists enrolled in the competition can help you to solve the problem.
The discussion board is very active and full of knowledgeable and helpful African data scientists willing to assist you.
4. Leaderboard
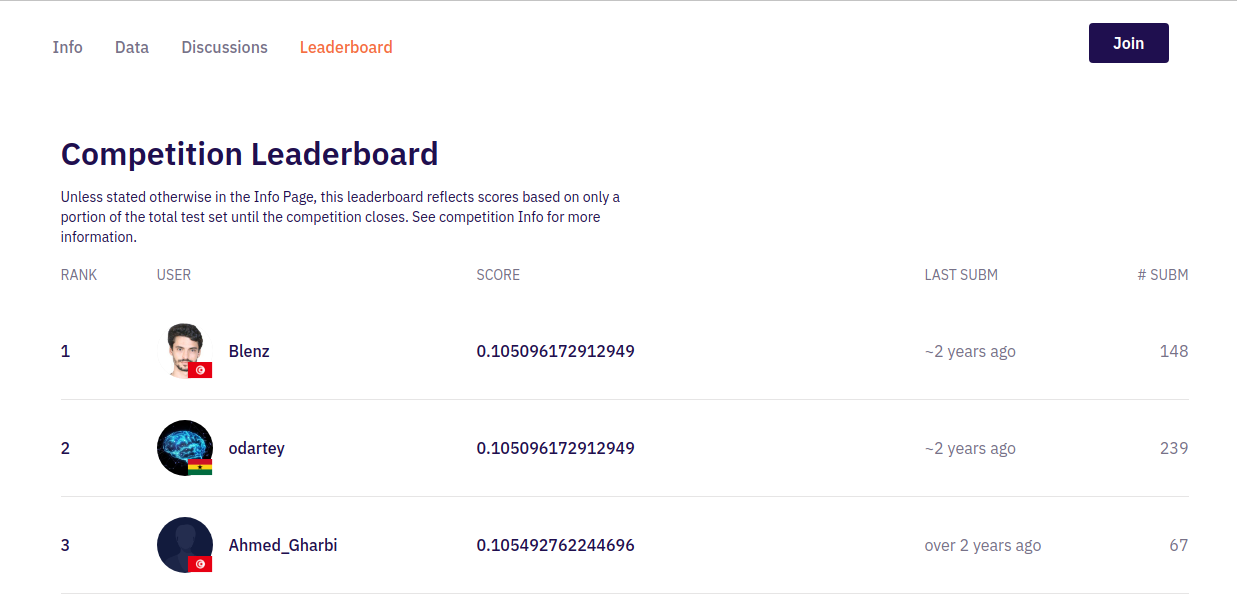
After you have uploaded your submission file, you will appear on the leaderboard. The leaderboard shows your position among all enrolled data scientists in the competition. Your position will depend on your performance after your solution has been evaluated. For this competition, you can submit ten times a day.
5. Team
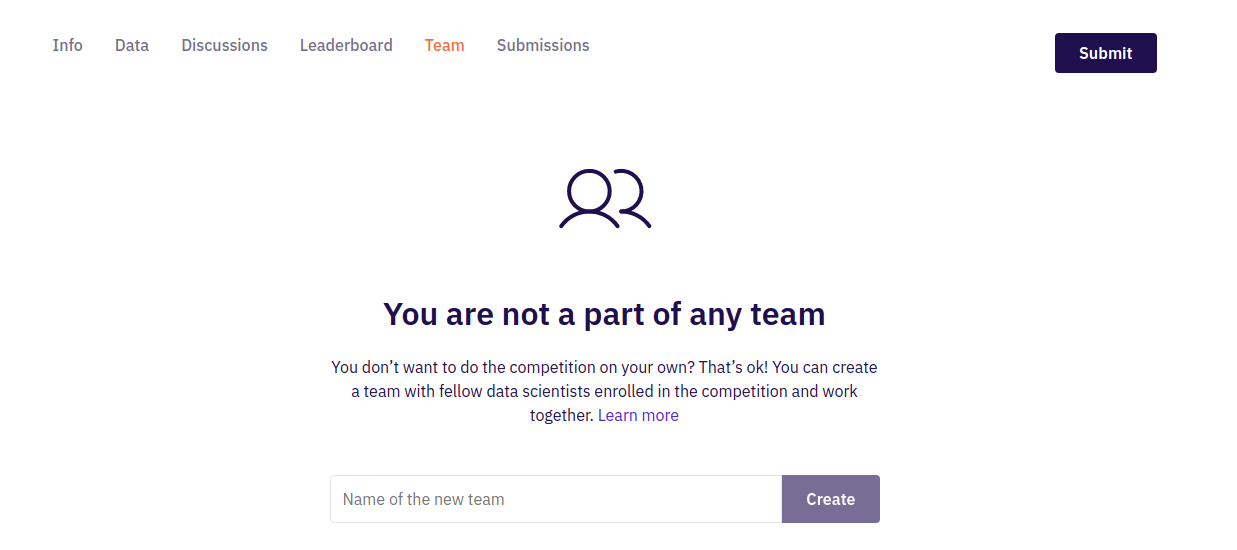
You don’t want to do the competition on your own? That’s OK! You can create a team with fellow data scientists enrolled in the competition and work together. The maximum number for a team is 4 members. Remember that sharing code between individuals is not allowed, so if you want to share code with someone else, they must be on the same team as you.
6. Submission
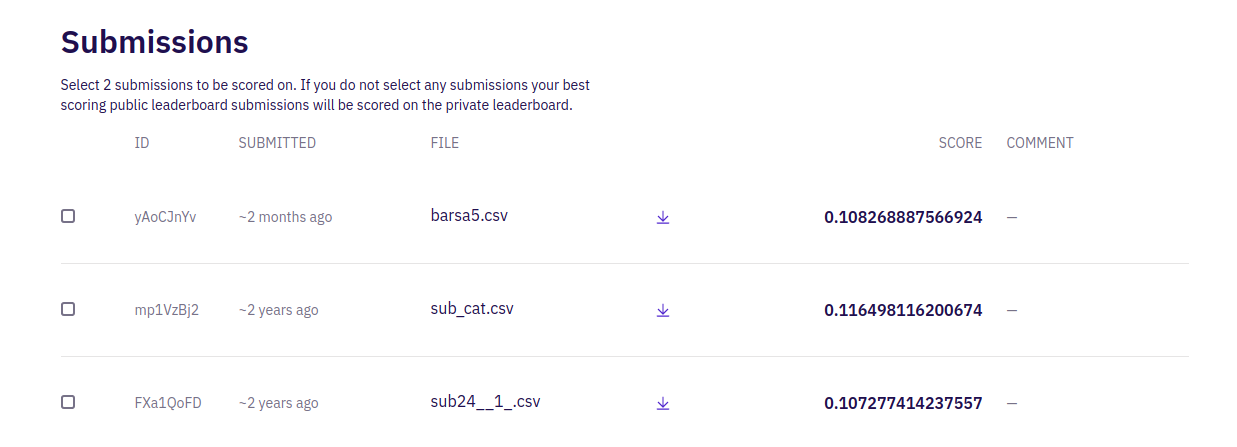
The submission page is where you will upload your submission file, by clicking the orange button at the top right side of the page. After you have uploaded your solution, it will be evaluated according to the evaluation metric specified in the competition. Then you will see the score that will define your position on the leaderboard.
Solve the problem
After understanding the Financial Inclusion in Africa competition page and its different sections, let’s solve the problem provided.
1. Load the dataset
Make sure you have downloaded the dataset provided in the competition. You can download the dataset here.
Import important python packages.
import pandas as pd
import numpy as np
import matplotlib.pyplot as plt
import seaborn as sns
import warnings
np.random.seed(123)
warnings.filterwarnings('ignore')
%matplotlib inline
Load the train and test dataset.
# Import data
train = pd.read_csv('data/Train.csv')
test = pd.read_csv('data/Test.csv')
Let’s observe the shape of our datasets.
# print shape
print('train data shape :', train.shape)
print('test data shape :', test.shape)
train data shape : (23524, 13)
test data shape : (10086, 12)
The above output shows the number of rows and columns for train and test dataset. We have 13 variables in the train dataset, 12 independent variables and 1 dependent variable. In the test dataset, we have 12 independent variables.
We can observe the first five rows from our data set by using the head() method from the pandas library.
# inspect train data
train.head()
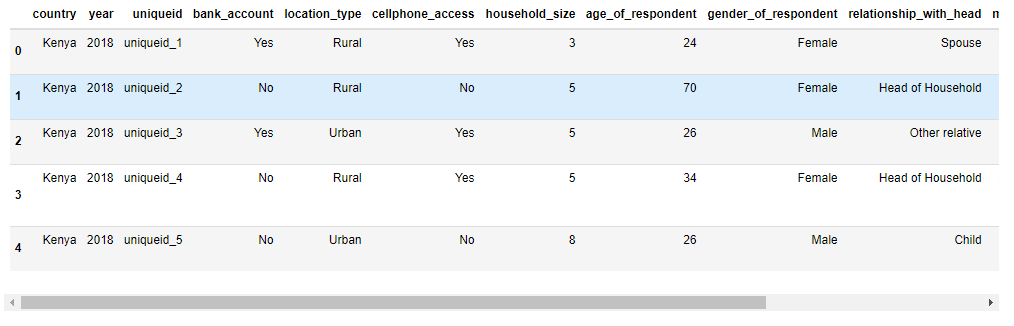
It is important to understand the meaning of each feature so you can really understand the dataset. You can read the VariableDefinition.csv file to understand the meaning of each variable presented in the dataset.
The SubmissionFile.csv gives us an example of how our submission file should look. This file will contain the uniqueid column combined with the country name from the Test.csv file and the target we predict with our model. Once we have created this file, we will submit it to the competition page and obtain a position on the leaderboard.
ss = pd.read_csv('data/SampleSubmission.csv')
ss.head()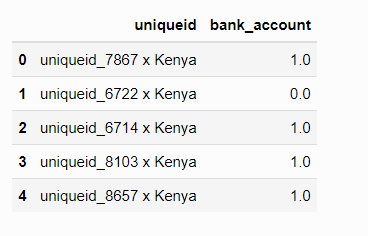
2. Understand the dataset
We can get more information about the features presented by using the info() method from pandas.
 #show some information about the dataset

 print(train.info())
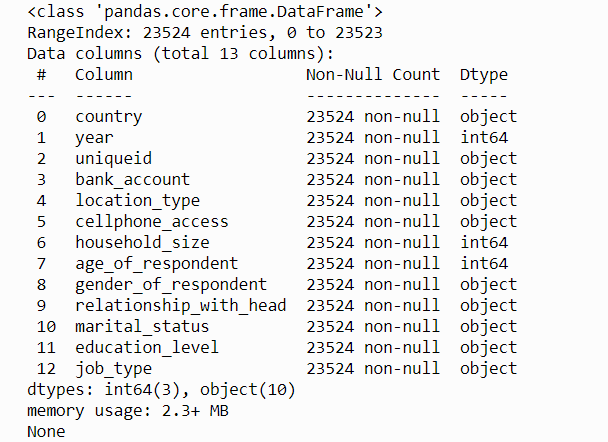
The output shows the list of variables/features, sizes, if it contains missing values and data type for each variable. From the dataset, we don’t have any missing values and we have 3 features of integer data type and 10 features of the object data type.
If you want to learn how to handle missing data in your dataset, we recommend you read How to handle missing data with python by Jason Brownlee.
We won’t go further on understanding the dataset because Davis has already published an article about exploratory data analysis (EDA) with the financial Inclusion in Africa dataset. You can read and download the notebook for EDA in the link below.
Why you need to explore your data and how you can start
3. Data preparation for machine learning
Before you train the model for prediction, you need to perform data cleaning and preprocessing. This is a very important step; your model will not perform well without these steps.
The first step is to separate the independent variables and target(bank_account) from the train data. Then transform the target values from the object data type into numerical by using LabelEncoder.
#import preprocessing module
from sklearn.preprocessing import LabelEncoder
from sklearn.preprocessing import MinMaxScaler

# Cobvert target label to numerical Data
le = LabelEncoder()
train['bank_account'] = le.fit_transform(train['bank_account'])

#Separate training features from target
X_train = train.drop(['bank_account'], axis=1)
y_train = train['bank_account']

print(y_train)
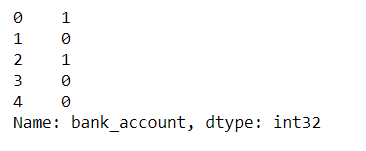
The target values have been transformed into numerical datatypes, 1 represents ‘Yes’ and 0 represents ‘No’.
We have created a simple preprocessing function to:
- Handle conversion of data types
- Convert categorical features to numerical features by using One-hot Encoder and Label Encoder
- Drop uniqueid variable
- Perform feature scaling.
The processing function will be used for both train and test independent variables.
# function to preprocess our data from train models

def preprocessing_data(data):

    # Convert the following numerical labels from interger to float
    float_array = data[["household_size", "age_of_respondent", "year"]].values.astype(float
    )

    # categorical features to be onverted to One Hot Encoding
    categ = [
        "relationship_with_head",
        "marital_status",
        "education_level",
        "job_type",
        "country"
    ]

    # One Hot Encoding conversion
    data = pd.get_dummies(data, prefix_sep="_", columns=categ)

    # Label Encoder conversion
    data["location_type"] = le.fit_transform(data["location_type"])
    data["cellphone_access"] = le.fit_transform(data["cellphone_access"])
    data["gender_of_respondent"] = le.fit_transform(data["gender_of_respondent"])

    # drop uniquid column
    data = data.drop(["uniqueid"], axis=1)

    # scale our data into range of 0 and 1
    scaler = MinMaxScaler(feature_range=(0, 1))
    data = scaler.fit_transform(data)

    return data
Preprocess both train and test dataset.
# preprocess the train data
processed_train = preprocessing_data(X_train)
processed_test = preprocessing_data(test_data)
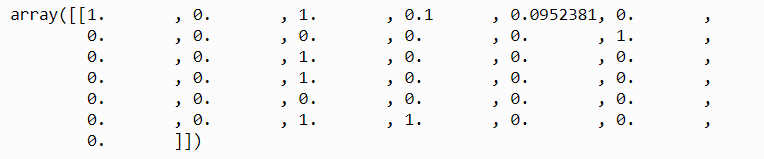
Observe the first row in the train data.
# the first train row
print(processed_train[:1])
Observe the shape of the train data.
# shape of the processed train set
print(processed_train.shape)
(23524, 37)
Now we have more independent variables than before (37 variables). This doesn’t mean all these variables are important to train our model. You need to select only important features that can increase the performance of the model. But we will not apply any feature selection technique in this article; if you want to learn and know more about feature selection techniques, we recommend you read the following articles:
- Introduction to Feature Selection methods with an example (or how to select the right variables?).
- The 5 Feature Selection Algorithms every Data Scientist should know.
- How to Choose a Feature Selection Method For Machine Learning.
- Feature Selection Techniques in Machine Learning with Python.
4. Model Building and Experiments
A portion of the train data set will be used to evaluate our models and find the best one that performs well before using it in the test dataset.
# Split train_data
from sklearn.model_selection import train_test_spilt

X_Train, X_Val, y_Train, y_val = train_test_split(processed_train, y_train, stratify = y_train,
test_size = 0.1, random_state=42)
Only 10% of the train dataset will be used for evaluating the models. The parameter stratify = y_train will ensure an equal balance of values from both classes (‘yes’ and ‘no’) for both train and validation set.
We have selected five algorithms for this classification problem to train and predict who is most likely to have a bank account.
From these algorithms, we can find the one that performs better than the others. We will start by training these models using the train set after splitting our train dataset.
#import classifier algorithm here
from sklearn.linear_model import LogisticRegression
from sklearn.ensemble import RandomForestClassifier
from sklearn.neighbors import KNeighborClassifier
from sklearn.ensemble import ExtraTreesClassifier
from xgboost import XGBClassifier

# create models
lg_model = LogisticRegression()
rf_model = RandomForestClassifier()
kn_model = KNeighborsClassifier()
et_model = ExtraTreesClassifier()
xg_model = XGBClassifier()

#fitting the models
lg_model.fit(X_Train,y_Train)
rf_model.fit(X_Train,y_Train)
kn_model.fit(X_Train,y_Train)
et_model.fit(X_Train,y_Train)
xg_model.fit(X_Train,y_Train)
After training five models, let’s use the trained models to predict our evaluation set and see how these models perform. We will use the evaluation metric provided on the competition page. The statement from the competition page stated that:
The evaluation metric for this challenge will be the percentage of survey respondents for whom you predict the binary 'bank account' classification incorrectly.
This means the lower the incorrect percentage we get, the better the model performance.
# import evaluation metrics
from sklearn.metrics import confusion_matrix, accuracy_score

# evaluate the model
lg_y_pred = lg_model.predict(X_Val)
rf_y_pred = rf_model.predict(X_Val)
kn_y_model = kn_model.predict(X_Val)
et_y_model = et_model.predict(X_Val)
xg_y_model = xg_model.predict(X_Val)

# Get error rate
print("Error rate Logistic Regression classifier: ", 1 - accuracy_score(y_val, lg_y_model))
print("Error rate of Random Forest classifier: ", 1 - accuracy_scorey_val, rf_model))
print("Error rate of Extra Tree classifier: ", 1 - accuracy_score(y_val, et_y_model))
print("Error rate of XGB classifier: ", 1 - accuracy_score(y_val, xg_y_model))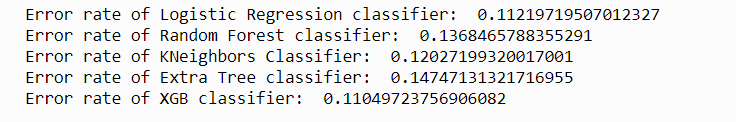
XGBoost classifier performs better than other models with 0.110 incorrect.
Let’s check the confusion matrix for XGB model.
from sklearn.metrics import plot_confusion_matrix

# Get confusion matrix for Gradient Boosting Classifier
plot_confusion_matrix( xg_model,X_Val,y_val,normalize='true')
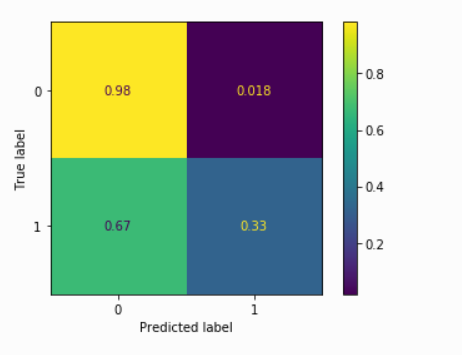
Our XGBoost model performs well on predicting class 0 and performs poorly on predicting class 1, it may be caused by the imbalance of data provided(the target variable has more ‘No’ values than ‘Yes’ values). You can learn the best way to deal with imbalanced data here.
One way to increase the model performance is by applying the Grid search method as an approach to parameter tuning that will methodically build and evaluate a model for each combination of algorithm parameters specified in a grid.
# Import GridSearchCV
from sklearn.model_selection import GridSearchCV
# Optimize model parameters
# I run this code in google colab to make the execution much faster and use the best params in the next code
param_grid = {'min_child_weighth': [1, 5, 10],
'gamma': [0.5, 1],
'subsample': [0.6, 0.8, 1.0],
'max_depth': [3, 5]
}
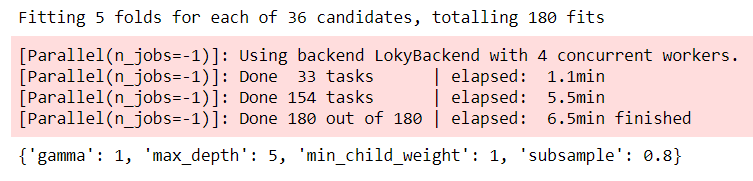
my_xgb_model = GridSearchCV(xg_model, param_grid,n_jobs=-1,verbose=2,cv=5)
my_xgb_model.fit(X_Train, y_Train)
print(my_xgb_model.best_params_) The above source code will evaluate which parameter values for min_child_weight, gamma, subsample and max_depth will give us better performance.
Let’s use these parameter values and see if the XGB model performance will increase.
from sklearn.metrics import confusion_matrix, accuracy_score

# fit by setting best parameters and Evaluate model
xgb_model = XGBClassifier(min_child_weight=1, gamma=1, subsample=0.8, max_depth=5)

xgb_model.fit(X_Train, y_Train)
y_pred = xgb_model.predict(X_val)

# Get error rate
print("Error rate of the XGB classifier: ", 1 - accuracy_score(y_val, y_pred))
Error rate of the XGB model: 0.10837229069273269
Our XGB model has improved from the previous performance of 0.110 to 0.108.
5. Making the first submission
After improving the XGBoost model performance, let’s now see how the model performs on the competition test data set provided and how we rank on the competition leaderboard.
First, we make predictions on the competition test data set.
# Get the predicted result for the test Data
test.bank_account = xgb_model.predict(processed_test)
Then we create a submission file according to the instruction provided in the SubmissionFile.csv.
# Create submission DataFrame
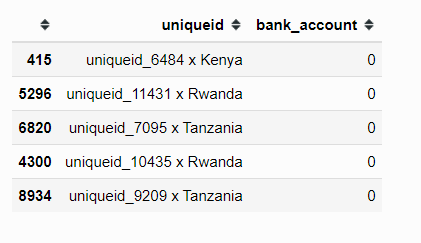
submission = pd.DataFrame({"uniqueid": test["uniqueid"] + " x " + test["country"],
"bank_account": test.bank_account})Let’s observe the sample results from our submission DataFrame.
#show the five sample
submission.sample(5)
Save results in the CSV file.
# Create submission csv file csv file
submission.to_csv('first_submission.csv', index = False)
We named our submission file a first_submission.csv. Now we can upload it to the Zindi competition page by clicking the submit button and selecting the file to upload., You also have an option to add comments for each submission.
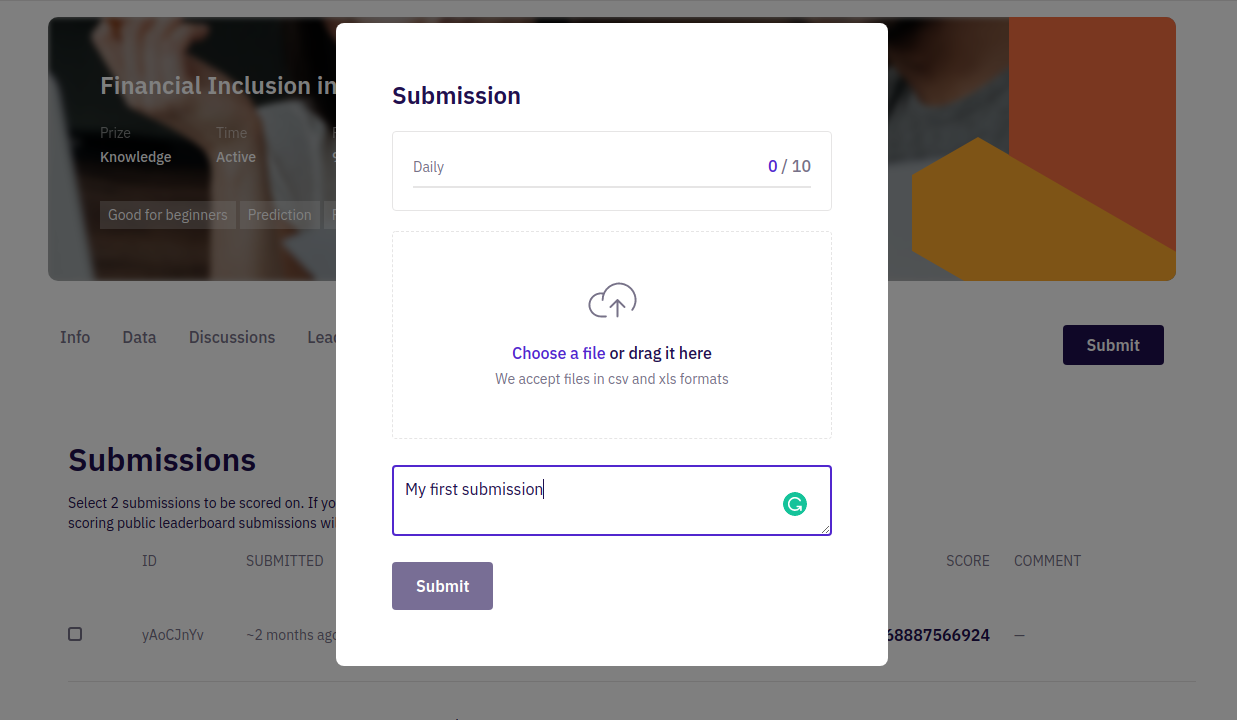
Then click the submit button to upload your submission file. Congratulations, you just made your first Zindi submission! The system will evaluate your results according to the evaluation methods for this competition.

Now you can see the performance of our XGB model is 0.109 on the test dataset provided.
You can also see your position on the Leaderboard.
Wrap up
In this article, we have given an overview of how to make your first submission to a Zindi competition. We suggest you take further steps to handle the imbalance of data and find alternative feature engineering and selection techniques you can apply to increase your model performance, or trying other machine learning algorithms. If you get stuck, don’t forget to ask for help on the discussion boards!
You can access the notebook for this article in the link below.
Davisy/How-to-Enter-Your-First-Zindi-Competition
If you learned something new or enjoyed reading this article, please share it so that others can see it. Feel free to leave a comment on the discussion board too.
About the author
Davis David is a data scientist at ParrotAI and Zindi Ambassador. He is passionate about artificial intelligence, machine learning, deep learning and big data. He is a co-organizer and facilitator of the AI movement in Tanzania; conducting AI meetups, workshops and events with a passion to build a community of data scientists to solve local problems. He can be reached on Twitter @Davis_McDavid.
You can read the original blog post here.
looks good
It is a great opportunity!!!
This would be a great start for me
let me make myself busy with this
it so helpful!!!
it is good